OPEN-SOURCE SCRIPT
Cập nhật Sizeblock
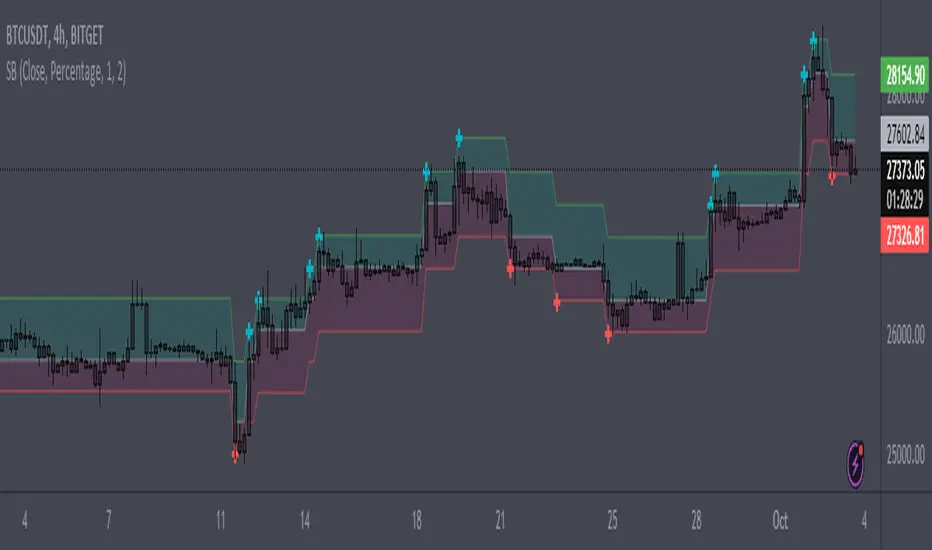
Price change indicator in the form of diagonal rows.
The calculation is based on the percentage or tick deviation of the price movement (indicated in the "Deviation" parameter), which is displayed on the chart in the form of rows.
The row consists of the base middle line, upper and lower limits:
The base middle line is equal to the upper or lower limits of the previous row (if the price changes rapidly in one time interval, then the base middle line of the current row is greater than the upper limit of the previous row or less than the lower limit of the previous row by an equal number of deviations depending on the direction of price movement). At the beginning of the calculation, the base middle line is equal to the initial value of the first row.
The "Quantity" parameter determines the deviation for the upper or lower limits depending on the direction of the price movement, and the "U-turn" parameter determines the deviation for changing the direction of the price movement.
The rule for constructing a new row:
By adjusting certain deviations, you can clearly see the local trend and reversal points on the chart.
A useful tool for tracking price direction.
Thanks for your attention!
The calculation is based on the percentage or tick deviation of the price movement (indicated in the "Deviation" parameter), which is displayed on the chart in the form of rows.
The row consists of the base middle line, upper and lower limits:
- The middle line is the basis for the upper and lower limits of the current row.
- The upper and lower limits are deviations from the base middle line of the current row.
The base middle line is equal to the upper or lower limits of the previous row (if the price changes rapidly in one time interval, then the base middle line of the current row is greater than the upper limit of the previous row or less than the lower limit of the previous row by an equal number of deviations depending on the direction of price movement). At the beginning of the calculation, the base middle line is equal to the initial value of the first row.
The "Quantity" parameter determines the deviation for the upper or lower limits depending on the direction of the price movement, and the "U-turn" parameter determines the deviation for changing the direction of the price movement.
The rule for constructing a new row:
- The "Source" parameter accepts, depending on the choice, the price of high, low values or the closing price from the time interval of the chart.
- When the price reaches the upper or lower limits of the row and goes beyond them, a new row is formed with the same parameters for deviation of the upper and lower limits from the base middle line, depending on the direction of price movement.
By adjusting certain deviations, you can clearly see the local trend and reversal points on the chart.
A useful tool for tracking price direction.
Thanks for your attention!
Phát hành các Ghi chú
Updating code.Phát hành các Ghi chú
Updating chart.Mã nguồn mở
Theo đúng tinh thần TradingView, tác giả của tập lệnh này đã công bố nó dưới dạng mã nguồn mở, để các nhà giao dịch có thể xem xét và xác minh chức năng. Chúc mừng tác giả! Mặc dù bạn có thể sử dụng miễn phí, hãy nhớ rằng việc công bố lại mã phải tuân theo Nội quy.
Thông báo miễn trừ trách nhiệm
Thông tin và các ấn phẩm này không nhằm mục đích, và không cấu thành, lời khuyên hoặc khuyến nghị về tài chính, đầu tư, giao dịch hay các loại khác do TradingView cung cấp hoặc xác nhận. Đọc thêm tại Điều khoản Sử dụng.
Mã nguồn mở
Theo đúng tinh thần TradingView, tác giả của tập lệnh này đã công bố nó dưới dạng mã nguồn mở, để các nhà giao dịch có thể xem xét và xác minh chức năng. Chúc mừng tác giả! Mặc dù bạn có thể sử dụng miễn phí, hãy nhớ rằng việc công bố lại mã phải tuân theo Nội quy.
Thông báo miễn trừ trách nhiệm
Thông tin và các ấn phẩm này không nhằm mục đích, và không cấu thành, lời khuyên hoặc khuyến nghị về tài chính, đầu tư, giao dịch hay các loại khác do TradingView cung cấp hoặc xác nhận. Đọc thêm tại Điều khoản Sử dụng.