OPEN-SOURCE SCRIPT
Confluence Zone Calculation for Support in Bullish Tends
Confluence Zone Calculation for Support in Bullish Tends
(or Restance in bearish ones)
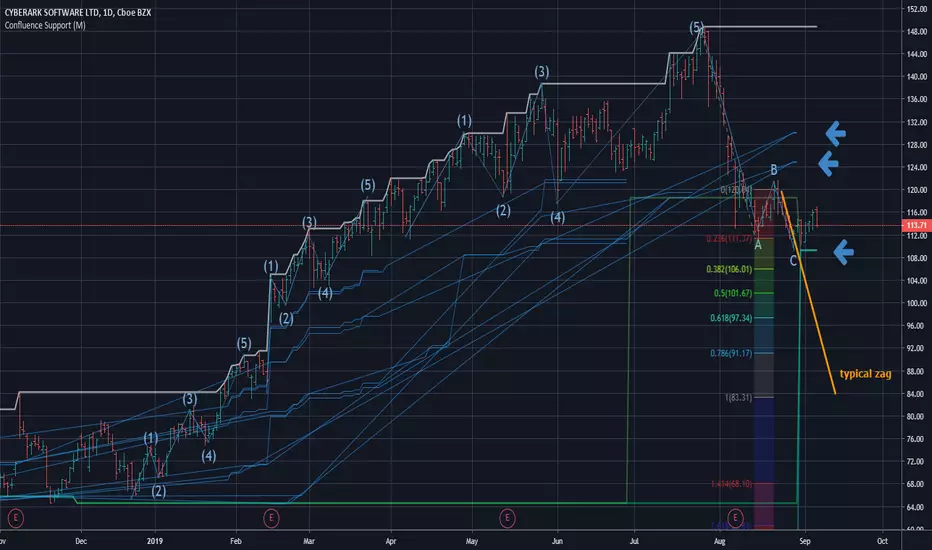
Ever wondered why sometimes the zag of an Elliot Wave zigzag is stopped after just a few points?
(Like in the given Chart where I draw a line for a typical zag action.)
It has often to do with confluence Zones. Most people think that the lower edge of a narrow range, repeated a few times, creates big support - confluence zones are stronger.
You can make them visible by getting fibonaccis from just one specific high to several different significant lows (for example the range lines mentioned above). The areas where significant lows and their fibos appear very close together are confluence zones. They can brake a falling price like a security net.
This script caluculates Confluence zones for you by using a second useful "secret": the secret that signifant lows test or create temporal rsi lows (vice-verse with highs).
The thicker (non-aqua clored)lines show actual lows, are corresponding with those rsi lows, the thinner are fibo lines deriving from them. (The white line stands for the high taken for the calculation.)
Note: Only those lines are valid which reach to the actual last bar.
Best practise is to let the script calculate,then redraw your lines of interest by hand and get rid of the rest of the spider web-like turmoil of lines by deleting the script from the chart.
Note further: I had to omit some calculations, because otherwise calculation time gets too long for TV and it stops with calculation Time out. (For your transparency I calculated all fibo codes but skipped some in "sline"-function; the number-suffix makes a jump when i omit a value ).
Note further further: Resistance confluence lines for bullish trends need a different script, because if you do it totally right vou in this case work from a single LOW of your interest.
I hope it enriches your knowledge and is a help for your studies and tradings.
Feedback and Questions welcome
yoxxx
(or Restance in bearish ones)
Ever wondered why sometimes the zag of an Elliot Wave zigzag is stopped after just a few points?
(Like in the given Chart where I draw a line for a typical zag action.)
It has often to do with confluence Zones. Most people think that the lower edge of a narrow range, repeated a few times, creates big support - confluence zones are stronger.
You can make them visible by getting fibonaccis from just one specific high to several different significant lows (for example the range lines mentioned above). The areas where significant lows and their fibos appear very close together are confluence zones. They can brake a falling price like a security net.
This script caluculates Confluence zones for you by using a second useful "secret": the secret that signifant lows test or create temporal rsi lows (vice-verse with highs).
The thicker (non-aqua clored)lines show actual lows, are corresponding with those rsi lows, the thinner are fibo lines deriving from them. (The white line stands for the high taken for the calculation.)
Note: Only those lines are valid which reach to the actual last bar.
Best practise is to let the script calculate,then redraw your lines of interest by hand and get rid of the rest of the spider web-like turmoil of lines by deleting the script from the chart.
Note further: I had to omit some calculations, because otherwise calculation time gets too long for TV and it stops with calculation Time out. (For your transparency I calculated all fibo codes but skipped some in "sline"-function; the number-suffix makes a jump when i omit a value ).
Note further further: Resistance confluence lines for bullish trends need a different script, because if you do it totally right vou in this case work from a single LOW of your interest.
I hope it enriches your knowledge and is a help for your studies and tradings.
Feedback and Questions welcome
yoxxx
Mã nguồn mở
Theo đúng tinh thần TradingView, tác giả của tập lệnh này đã công bố nó dưới dạng mã nguồn mở, để các nhà giao dịch có thể xem xét và xác minh chức năng. Chúc mừng tác giả! Mặc dù bạn có thể sử dụng miễn phí, hãy nhớ rằng việc công bố lại mã phải tuân theo Nội quy.
Thông báo miễn trừ trách nhiệm
Thông tin và các ấn phẩm này không nhằm mục đích, và không cấu thành, lời khuyên hoặc khuyến nghị về tài chính, đầu tư, giao dịch hay các loại khác do TradingView cung cấp hoặc xác nhận. Đọc thêm tại Điều khoản Sử dụng.