OPEN-SOURCE SCRIPT
Cập nhật Stationary Extrapolated Levels Oscillator
Introduction
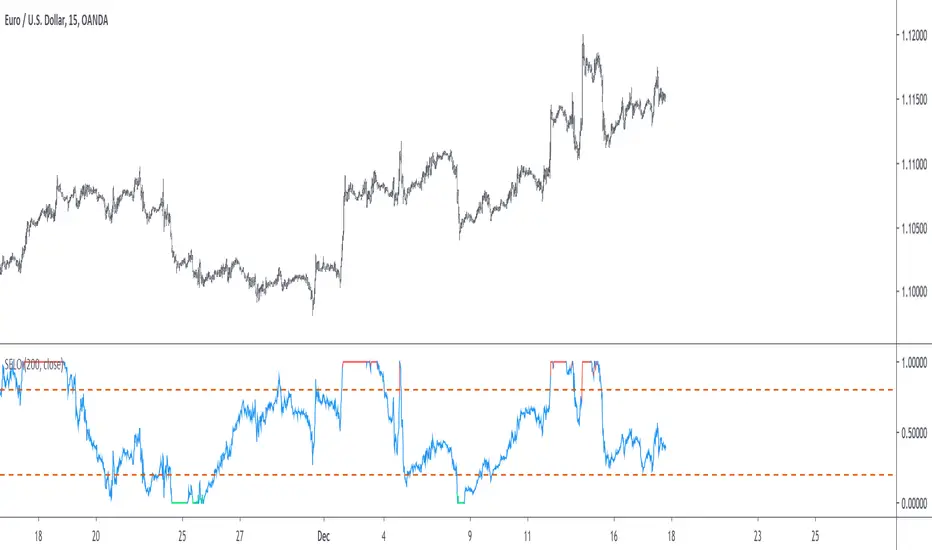
The oscillator version of the stationary extrapolated levels indicator. The methodology behind the extrapolated levels where to minimize the risk of making a decision based only on a forecast, therefore the indicator plotted levels in order to determine possible reversal points, signals where generated when the detrended series crossed over/under those levels.
The Indicator
First we detrend the price, this is because forecasting the trend is often harder than a series without trend (stationarity > non-stationarity), then we forecast the detrended price with a linear extrapolation over a period of length and apply a max/min filter twice to the forecast, the max/min filters are just the highest and lowest function in pine. So the max/min filter have lag length/2, by applying it two times we have a lag of length which is the period of the forecast. Because we use highest and lowest we can apply min-max normalization in the form of :
x' = (x - min(x, min'))/(max(x,max') - min(x, min'))
where x is the detrended price, max' the highest of the forecast of x and min' the lowest of the forecast of x. This result in a scaled oscillator in a range of (1,0),
When the indicator is equal to 1 or 0 there are high chances of reversals, more in depth this mean that the detrended price have crossed the highest/lowest of the forecast, when the indicator is equal to 0 or 1 for a long time this mean that the forecast was quite inaccurate, you can minimize risk by focusing on the cross between the detrended price and the 0.8/0.2 levels.
Conclusion
I've shown an oscillator version of my previous "Stationary extrapolated levels" indicator, the method involving taking the highest and lowest of the forecast is a great way to minimize the risk involved by time-series forecasting driven decisions. So i hope you find an use to it.
Thanks for reading !
Phát hành các Ghi chú
- v4- additional changes
Mã nguồn mở
Theo đúng tinh thần TradingView, tác giả của tập lệnh này đã công bố nó dưới dạng mã nguồn mở, để các nhà giao dịch có thể xem xét và xác minh chức năng. Chúc mừng tác giả! Mặc dù bạn có thể sử dụng miễn phí, hãy nhớ rằng việc công bố lại mã phải tuân theo Nội quy.
Check out the indicators we are making at luxalgo: tradingview.com/u/LuxAlgo/
"My heart is so loud that I can't hear the fireworks"
"My heart is so loud that I can't hear the fireworks"
Thông báo miễn trừ trách nhiệm
Thông tin và các ấn phẩm này không nhằm mục đích, và không cấu thành, lời khuyên hoặc khuyến nghị về tài chính, đầu tư, giao dịch hay các loại khác do TradingView cung cấp hoặc xác nhận. Đọc thêm tại Điều khoản Sử dụng.