OPEN-SOURCE SCRIPT
Cập nhật Zone Strength [wbburgin]
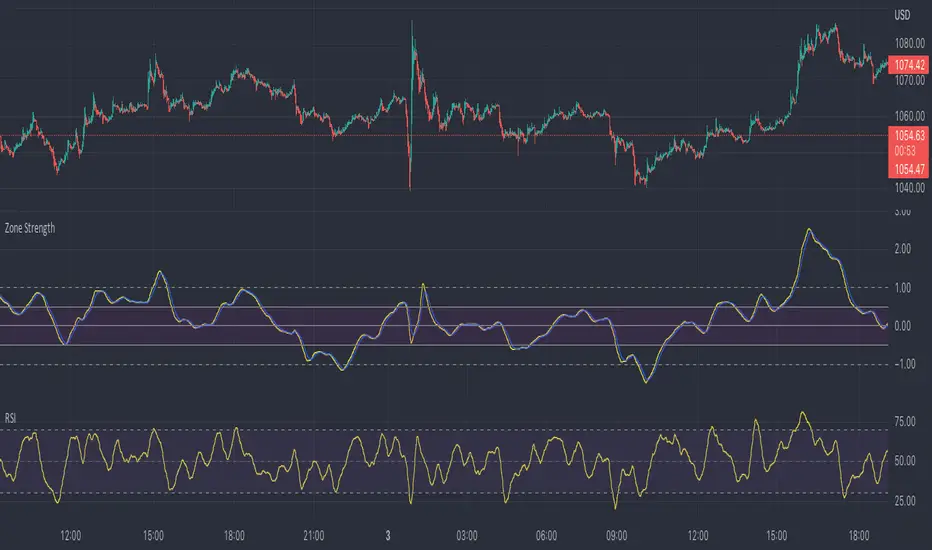
The Zone Strength indicator is a multifaceted indicator combining volatility-based, momentum-based, and support-based metrics to indicate where a trend reversal is likely.
I recommend using it with the RSI at normal settings to confirm entrances and exits.
The indicator first uses a candle’s wick in relation to its body, depending on whether it closes green or red, to determine ranges of volatility.
The maxima of these volatility statistics are registered across a specific period (the “amplitude”) to determine regions of current support.
The “wavelength” of this statistic is taken to smooth out the Zone Strength’s final statistic.
Finally, the ratio of the difference between the support and the resistance levels is taken in relation to the candle to determine how close the candle is to the “Buy Zone” (<-0.5) or the “Sell Zone” (>0.5).
wbburgin
Phát hành các Ghi chú
Option to not show tertiary resistance lines (and make the plot appear easier to see).Phát hành các Ghi chú
Ease-of-use update! Added a bunch of customizable MA features and made the interface easier to change.Mã nguồn mở
Theo đúng tinh thần TradingView, tác giả của tập lệnh này đã công bố nó dưới dạng mã nguồn mở, để các nhà giao dịch có thể xem xét và xác minh chức năng. Chúc mừng tác giả! Mặc dù bạn có thể sử dụng miễn phí, hãy nhớ rằng việc công bố lại mã phải tuân theo Nội quy.
FAQ: I am gradually phasing out my Patreon because of the time it takes to maintain.
BTC: 35PdMMMXFCvPjXKwn8wsRFNwMEPgStaKUJ
Test my strategies on CryptoRobotics: cryptorobotics.co/?trade=f23b09
BTC: 35PdMMMXFCvPjXKwn8wsRFNwMEPgStaKUJ
Test my strategies on CryptoRobotics: cryptorobotics.co/?trade=f23b09
Thông báo miễn trừ trách nhiệm
Thông tin và các ấn phẩm này không nhằm mục đích, và không cấu thành, lời khuyên hoặc khuyến nghị về tài chính, đầu tư, giao dịch hay các loại khác do TradingView cung cấp hoặc xác nhận. Đọc thêm tại Điều khoản Sử dụng.
Mã nguồn mở
Theo đúng tinh thần TradingView, tác giả của tập lệnh này đã công bố nó dưới dạng mã nguồn mở, để các nhà giao dịch có thể xem xét và xác minh chức năng. Chúc mừng tác giả! Mặc dù bạn có thể sử dụng miễn phí, hãy nhớ rằng việc công bố lại mã phải tuân theo Nội quy.
FAQ: I am gradually phasing out my Patreon because of the time it takes to maintain.
BTC: 35PdMMMXFCvPjXKwn8wsRFNwMEPgStaKUJ
Test my strategies on CryptoRobotics: cryptorobotics.co/?trade=f23b09
BTC: 35PdMMMXFCvPjXKwn8wsRFNwMEPgStaKUJ
Test my strategies on CryptoRobotics: cryptorobotics.co/?trade=f23b09
Thông báo miễn trừ trách nhiệm
Thông tin và các ấn phẩm này không nhằm mục đích, và không cấu thành, lời khuyên hoặc khuyến nghị về tài chính, đầu tư, giao dịch hay các loại khác do TradingView cung cấp hoặc xác nhận. Đọc thêm tại Điều khoản Sử dụng.