OPEN-SOURCE SCRIPT
Cập nhật EMA 50 & 200 (TF-specific)
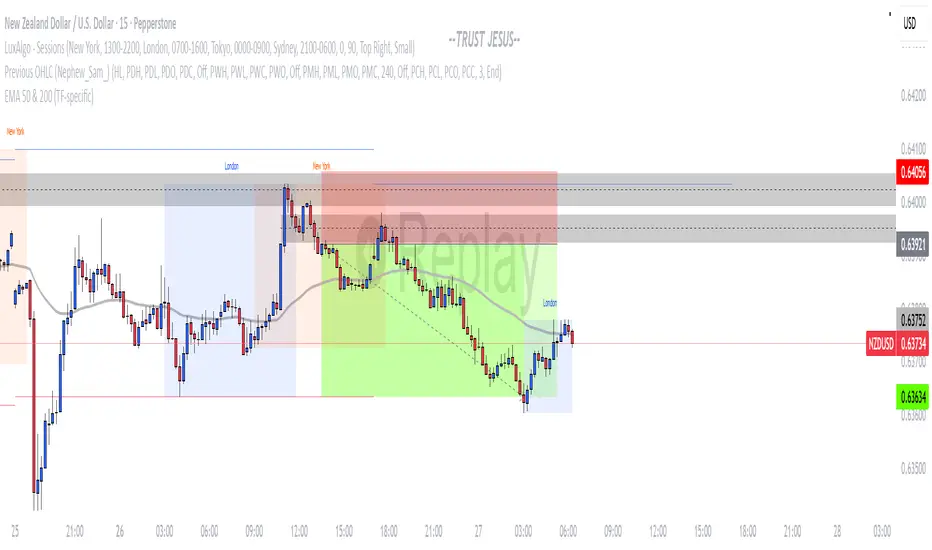
This script plots EMA 50 and EMA 200 only on the timeframes where they matter most:
EMA 50 (gray): visible on 1H, 4H, and 12H charts – often used by intraday traders.
EMA 200 (black): visible on Daily and Weekly charts – a classic long-term trend indicator.
🔹 Why use it?
Avoids clutter by showing each EMA only on the relevant timeframe.
Helps align intraday trading with higher timeframe trends.
Simple, clean, and effective for both swing and day trading.
Phát hành các Ghi chú
This script plots EMA 50 and EMA 200 only on the timeframes where they matter most:EMA 50 (gray): visible on 5m, 15m, 30m, 1H, 4H, and 12H charts – often used by intraday traders.
EMA 200 (black): visible on Daily and Weekly charts – a classic long-term trend indicator.
🔹 Why use it?
Avoids clutter by showing each EMA only on the relevant timeframe.
Helps align intraday trading with higher timeframe trends.
Simple, clean, and effective for both swing and day trading.
Mã nguồn mở
Theo đúng tinh thần TradingView, người tạo ra tập lệnh này đã biến tập lệnh thành mã nguồn mở để các nhà giao dịch có thể xem xét và xác minh công năng. Xin dành lời khen tặng cho tác giả! Mặc dù bạn có thể sử dụng miễn phí, nhưng lưu ý nếu đăng lại mã, bạn phải tuân theo Quy tắc nội bộ của chúng tôi.
Thông báo miễn trừ trách nhiệm
Thông tin và ấn phẩm không có nghĩa là và không cấu thành, tài chính, đầu tư, kinh doanh, hoặc các loại lời khuyên hoặc khuyến nghị khác được cung cấp hoặc xác nhận bởi TradingView. Đọc thêm trong Điều khoản sử dụng.