OPEN-SOURCE SCRIPT
Price Oscillator TR
### Summary: How to Use the Price Oscillator with EMA Indicator
The **Price Oscillator with EMA** is a custom technical analysis tool designed to help traders identify potential buying and selling opportunities based on price momentum. Here's how to use it:
1. **Understanding the Oscillator**:
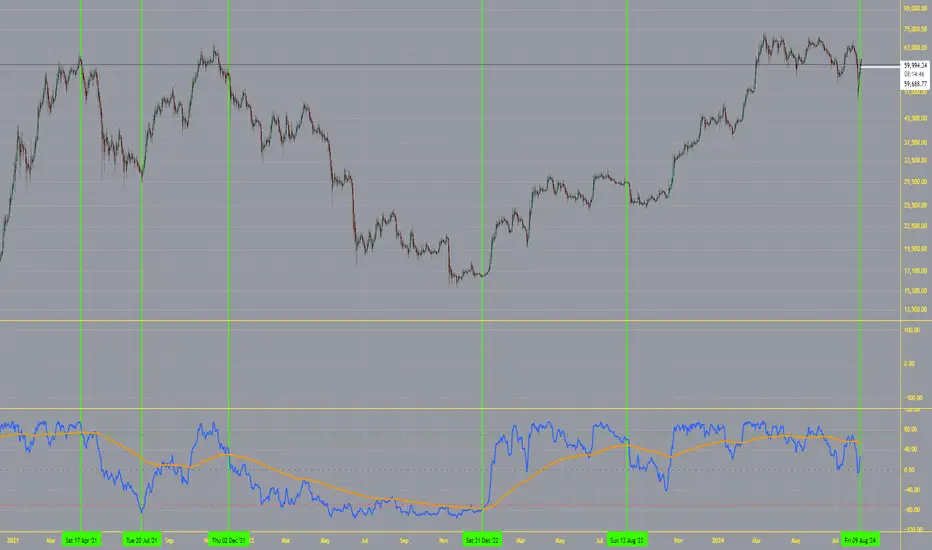
- The oscillator is calculated by normalizing the current price relative to the highest high and lowest low over a specified lookback period. It fluctuates between -70 and +70.
- When the oscillator is near +70, the price is close to the recent highs, indicating potential overbought conditions. Conversely, when it’s near -100, the price is close to recent lows, indicating potential oversold conditions.
2. **Exponential Moving Average (EMA)**:
- The indicator includes an EMA of the oscillator to smooth out price fluctuations and provide a clearer signal.
- The EMA helps to filter out noise and confirm trends.
3. **Trading Signals**:
- **Bullish Signal**: A potential buying opportunity is signaled when the oscillator crosses above its EMA. This suggests increasing upward momentum.
- **Bearish Signal**: A potential selling opportunity is signaled when the oscillator crosses below its EMA. This indicates increasing downward momentum.
4. **Visual Aids**:
- The indicator includes horizontal lines at +70, 0, and -70 to help you quickly assess overbought, neutral, and oversold conditions.
- The blue line represents the oscillator, while the orange line represents the EMA of the oscillator.
### How to Use:
- **Set your parameters**: Adjust the lookback period and EMA length to fit your trading strategy and time frame.
- **Watch for Crossovers**: Monitor when the oscillator crosses the EMA. A crossover from below to above suggests a buy, while a crossunder from above to below suggests a sell.
- **Confirm with Other Indicators**: For more reliable signals, consider using this indicator alongside other technical tools like volume analysis, trend lines, or support/resistance levels.
This indicator is ideal for traders looking to capture momentum-based trades in various market conditions.
The **Price Oscillator with EMA** is a custom technical analysis tool designed to help traders identify potential buying and selling opportunities based on price momentum. Here's how to use it:
1. **Understanding the Oscillator**:
- The oscillator is calculated by normalizing the current price relative to the highest high and lowest low over a specified lookback period. It fluctuates between -70 and +70.
- When the oscillator is near +70, the price is close to the recent highs, indicating potential overbought conditions. Conversely, when it’s near -100, the price is close to recent lows, indicating potential oversold conditions.
2. **Exponential Moving Average (EMA)**:
- The indicator includes an EMA of the oscillator to smooth out price fluctuations and provide a clearer signal.
- The EMA helps to filter out noise and confirm trends.
3. **Trading Signals**:
- **Bullish Signal**: A potential buying opportunity is signaled when the oscillator crosses above its EMA. This suggests increasing upward momentum.
- **Bearish Signal**: A potential selling opportunity is signaled when the oscillator crosses below its EMA. This indicates increasing downward momentum.
4. **Visual Aids**:
- The indicator includes horizontal lines at +70, 0, and -70 to help you quickly assess overbought, neutral, and oversold conditions.
- The blue line represents the oscillator, while the orange line represents the EMA of the oscillator.
### How to Use:
- **Set your parameters**: Adjust the lookback period and EMA length to fit your trading strategy and time frame.
- **Watch for Crossovers**: Monitor when the oscillator crosses the EMA. A crossover from below to above suggests a buy, while a crossunder from above to below suggests a sell.
- **Confirm with Other Indicators**: For more reliable signals, consider using this indicator alongside other technical tools like volume analysis, trend lines, or support/resistance levels.
This indicator is ideal for traders looking to capture momentum-based trades in various market conditions.
Mã nguồn mở
Theo đúng tinh thần TradingView, tác giả của tập lệnh này đã công bố nó dưới dạng mã nguồn mở, để các nhà giao dịch có thể xem xét và xác minh chức năng. Chúc mừng tác giả! Mặc dù bạn có thể sử dụng miễn phí, hãy nhớ rằng việc công bố lại mã phải tuân theo Nội quy.
Thông báo miễn trừ trách nhiệm
Thông tin và các ấn phẩm này không nhằm mục đích, và không cấu thành, lời khuyên hoặc khuyến nghị về tài chính, đầu tư, giao dịch hay các loại khác do TradingView cung cấp hoặc xác nhận. Đọc thêm tại Điều khoản Sử dụng.