HIPA - High IRL Probability Areas [Pro]
HIPA (High IRL Probability Areas) visualizes statistically derived Internal Range Liquidity (IRL) zones — price areas that have historically shown a higher tendency for revisit or interaction within an intraday session.
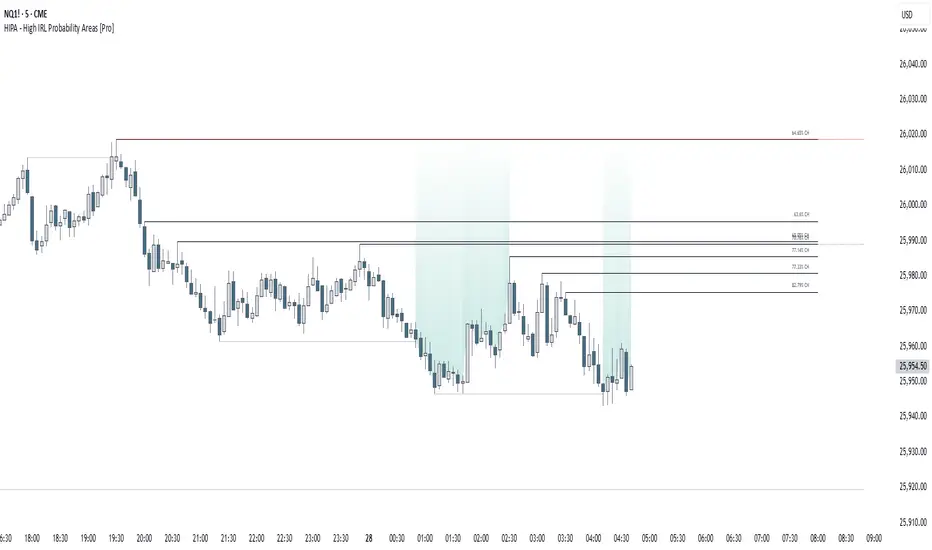
When a candle breaks a higher-timeframe reference bar’s high or low, HIPA plots a draw line at the opposite extreme of that bar, highlighting where liquidity is most likely to rest.
Each line displays a live, time-conditioned probability (CH) of being revisited before session end, plus an optional End-of-Day (EOD) probability.
HIPA provides statistical context on how current price interacts with prior structural ranges. It does not issue trade signals or forecasts.
Key Features
• Tracks higher-timeframe reference bars across the session.
• Plots draw lines at the opposite extreme once a break occurs.
• Displays dynamic CH and optional EOD probabilities derived from embedded historical statistics.
• Tested lines change style once price interacts; expired levels are automatically removed.
• Fully customizable palette, text size, and visibility options.
Signal Area Context
HIPA includes an optional Signal Area overlay that blends IRL probabilities with higher-timeframe (HTF) structure.
You can reference candle highs/lows or pivots from selected HTF intervals and display a subtle gradient between these external liquidity points and active IRL zones.
The shaded area is intended to help visualize where intraday behavior aligns with multi-timeframe liquidity zones — not to produce entries or exits.
Traders may use it to study how price develops around these confluence regions.
Methodology (transparency)
HIPA uses embedded statistical references derived from long-term historical market behavior to estimate revisit probabilities conditioned by time-of-day and break direction.
These references are stored directly within the script for deterministic plotting — no external data is fetched or required.
Session data is internally organized into consistent time segments to reflect how revisit tendencies vary through the day.
HIPA is descriptive: it visualizes empirically observed behavior, not predictive outcomes.
How to Use
- Apply HIPA to any intraday chart.
- Observe when price breaks a higher-timeframe candle’s high or low — a draw line appears at the opposite extreme with CH/EOD labels.
- Optionally enable the Signal Area to visualize overlap between HTF liquidity and current IRL zones.
- Use HIPA as structural and statistical context only; combine with your own framework for decision-making.
- Treat draw lines and gradients as reference areas rather than precise trade levels.
Notes
• Historical behavior can evolve under different market conditions.
• CH/EOD probabilities adjust with session time; interpret contextually.
• Rendering many lines simultaneously may affect performance — enable pruning if needed.
• Works on any symbol or timeframe supported by TradingView.
Disclaimers
Educational use only. Past performance does not guarantee future results.
HIPA visualizes statistical context based on historical behavior and does not predict or recommend trades.
Tập lệnh chỉ hiển thị cho người được mời
Chỉ những người dùng được tác giả chấp thuận mới có thể truy cập tập lệnh này. Bạn sẽ cần yêu cầu và được cấp quyền sử dụng. Thông thường quyền này được cấp sau khi thanh toán. Để biết thêm chi tiết, làm theo hướng dẫn của tác giả bên dưới hoặc liên hệ trực tiếp với LevelLogic.
TradingView KHÔNG khuyến nghị bạn trả phí hoặc sử dụng một tập lệnh trừ khi bạn hoàn toàn tin tưởng vào tác giả và hiểu cách hoạt động của tập lệnh. Bạn cũng có thể tìm các lựa chọn miễn phí, mã nguồn mở trong các script cộng đồng của chúng tôi.
Hướng dẫn của tác giả
Thông báo miễn trừ trách nhiệm
Tập lệnh chỉ hiển thị cho người được mời
Chỉ những người dùng được tác giả chấp thuận mới có thể truy cập tập lệnh này. Bạn sẽ cần yêu cầu và được cấp quyền sử dụng. Thông thường quyền này được cấp sau khi thanh toán. Để biết thêm chi tiết, làm theo hướng dẫn của tác giả bên dưới hoặc liên hệ trực tiếp với LevelLogic.
TradingView KHÔNG khuyến nghị bạn trả phí hoặc sử dụng một tập lệnh trừ khi bạn hoàn toàn tin tưởng vào tác giả và hiểu cách hoạt động của tập lệnh. Bạn cũng có thể tìm các lựa chọn miễn phí, mã nguồn mở trong các script cộng đồng của chúng tôi.