OPEN-SOURCE SCRIPT
MACD Histogram/Area
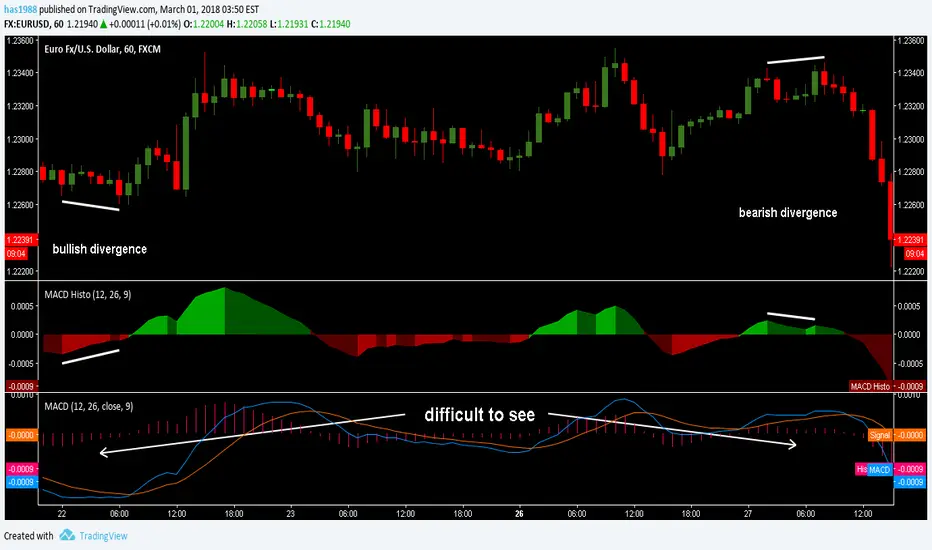
It´s just the histogram of the MACD. (Actually it´s not a histogram, I like the Area visualisation more. But you can switch.)
When I´m using the MACD, I´m just searching for a divergence between Price and the MACD-histogram. I´m not interested in the MACD-signalline or the MACD-line in any way. As you can see, The omission of them leads to better visualisation. It´s much easier to spot a divergence. On the one hand because that way the histogram scales bigger, on the other hand becauce the lines can´t overdraw the histogram.
Rules bullish Divergence: Price makes a lower low, oscillator makes higher low.
Rules bearish Divergence: Price makes a higher high, oscillator makes lower high.
Mã nguồn mở
Theo đúng tinh thần TradingView, tác giả của tập lệnh này đã công bố nó dưới dạng mã nguồn mở, để các nhà giao dịch có thể xem xét và xác minh chức năng. Chúc mừng tác giả! Mặc dù bạn có thể sử dụng miễn phí, hãy nhớ rằng việc công bố lại mã phải tuân theo Nội quy.
Thông báo miễn trừ trách nhiệm
Thông tin và các ấn phẩm này không nhằm mục đích, và không cấu thành, lời khuyên hoặc khuyến nghị về tài chính, đầu tư, giao dịch hay các loại khác do TradingView cung cấp hoặc xác nhận. Đọc thêm tại Điều khoản Sử dụng.