OPEN-SOURCE SCRIPT
byquan GP - SRSI Channel
🔍 What Is It?
The GP – SRSI Channel is a momentum-based oscillator that measures the relative strength of price movements across multiple timeframes using the Stochastic RSI (SRSI) method.
Instead of using a single RSI line, this indicator analyzes four price inputs and four timeframes to create a dynamic channel that reflects the true market momentum — helping traders identify overbought and oversold zones with higher accuracy.
⚙️ How It Works
The indicator combines multiple layers of analysis to produce a smooth and reliable momentum channel.
1. Multi-Source RSI Calculation
It computes RSI and Stochastic RSI values for four different price sources:
Open
High
Low
Close
Each source generates its own SRSI value:
dsopen, dshigh, dslow, and dsclose
From these, it extracts:
starraymin: the lowest (most oversold) SRSI value
starraymax: the highest (most overbought) SRSI value
This forms a momentum range based on all price inputs.
2. Multi-Timeframe (MTF) Integration
To strengthen signal reliability, it repeats this SRSI analysis across four higher timeframes (configurable by user):
Parameter Default Value Meaning
Time 1 180 minutes 3-hour chart
Time 2 360 minutes 6-hour chart
Time 3 720 minutes 12-hour chart
Time 4 1D Daily chart
Each timeframe produces its own set of minimum, maximum, and close SRSI values.
These are then combined and normalized to a 0–100 scale.
3. Normalization and Channel Plot
The combined results create three main lines:
Min Line (Green–Red gradient) → represents oversold strength
Max Line (Green–Red gradient) → represents overbought strength
Close Line (White) → represents average SRSI value
The area between the Min and Max lines is filled with a color gradient to form the SRSI Channel, visually showing momentum strength and range.
4. Signal & Alerts
Two alert levels are defined:
Alert Min Level → Default = 5 (oversold)
Alert Max Level → Default = 95 (overbought)
When:
oranmin ≤ Alert Min Level → Market is in an oversold state (potential reversal up).
oranmax ≥ Alert Max Level → Market is in an overbought state (potential reversal down).
When either of these thresholds is crossed, the indicator triggers:
A white square marker on the chart.
A custom alert with the message:
“SRSI Channel reached alert threshold (oranmax ≥ MaxLevel or oranmin ≤ MinLevel)”
🧭 How to Use It
🪄 Step 1 — Add to Chart
Copy the code into a new Pine Script in TradingView.
Click Add to chart.
You’ll see three lines and a colored channel between them.
⚙️ Step 2 — Adjust Inputs
Core SRSI Settings
Setting Description
K, D Smoothing factors for Stochastic RSI.
RSI Length Number of bars for RSI calculation.
S Length Period used for %K in Stochastic RSI.
Alert Min/Max Level Defines oversold/overbought zones.
Multi-Timeframe Settings
Change Time 1 to Time 4 to suit your trading style:
Shorter timeframes → faster but more noise.
Longer timeframes → smoother, more reliable momentum.
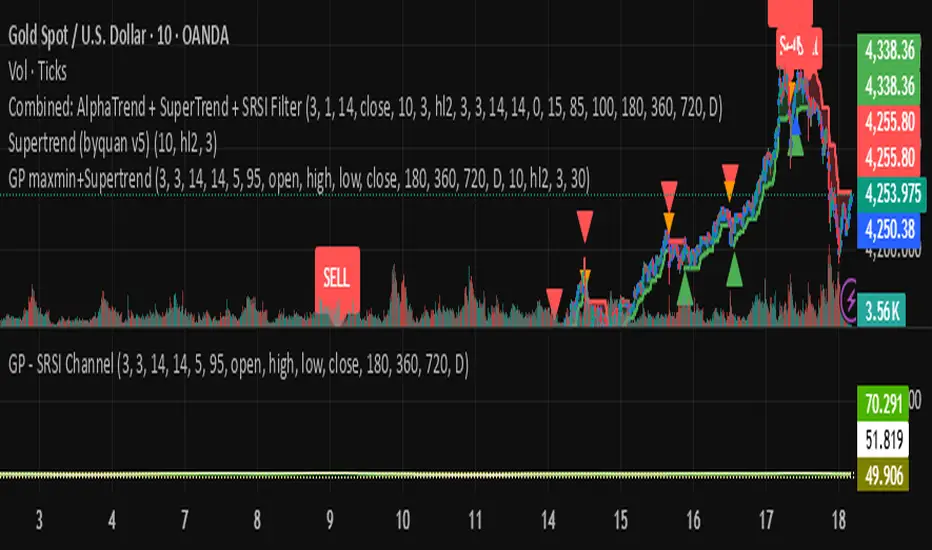
📈 Step 3 — Interpret the Chart
Indicator Element Meaning
🟩 Lower Boundary (Min) Lowest SRSI reading → momentum weakness / possible rebound area
🟥 Upper Boundary (Max) Highest SRSI reading → strong momentum / possible exhaustion
⚪ Middle Line (Close) Average of all SRSI readings → overall momentum strength
🌈 Channel Fill Visualizes balance between overbought and oversold levels
When the channel widens → market volatility and strength increase.
When it narrows → consolidation or low-momentum phase.
🔔 Step 4 — Alerts
You can create alerts using:
Condition: SRSI Extreme
Message: SRSI Channel reached alert threshold
Use this to receive notifications when the market hits extreme momentum levels (great for reversal traders).
💡 Trading Tips
✅ Combine with Supertrend, MACD, or Moving Averages for confirmation.
✅ Look for SRSI extremes aligning with price support/resistance for stronger reversal entries.
✅ Use different timeframe combinations (e.g., 1H–4H–12H–1D) depending on your trading style.
✅ Treat it as a momentum filter — not a direct buy/sell signal tool.
⚖️ Summary
The GP – SRSI Channel is a sophisticated multi-timeframe momentum indicator that helps traders visualize market strength and identify overbought or oversold conditions with exceptional clarity.
Features:
4 price sources × 4 timeframes = deep momentum insight
Dynamic, color-coded SRSI channel
Built-in alert system for extreme conditions
Clean and intuitive visual design
Best suited for:
Swing and position traders
Traders who use RSI/Stoch indicators
Those seeking to confirm entries with multi-timeframe momentum data
🎯 Understand the market’s true momentum — before it moves.
The GP – SRSI Channel is a momentum-based oscillator that measures the relative strength of price movements across multiple timeframes using the Stochastic RSI (SRSI) method.
Instead of using a single RSI line, this indicator analyzes four price inputs and four timeframes to create a dynamic channel that reflects the true market momentum — helping traders identify overbought and oversold zones with higher accuracy.
⚙️ How It Works
The indicator combines multiple layers of analysis to produce a smooth and reliable momentum channel.
1. Multi-Source RSI Calculation
It computes RSI and Stochastic RSI values for four different price sources:
Open
High
Low
Close
Each source generates its own SRSI value:
dsopen, dshigh, dslow, and dsclose
From these, it extracts:
starraymin: the lowest (most oversold) SRSI value
starraymax: the highest (most overbought) SRSI value
This forms a momentum range based on all price inputs.
2. Multi-Timeframe (MTF) Integration
To strengthen signal reliability, it repeats this SRSI analysis across four higher timeframes (configurable by user):
Parameter Default Value Meaning
Time 1 180 minutes 3-hour chart
Time 2 360 minutes 6-hour chart
Time 3 720 minutes 12-hour chart
Time 4 1D Daily chart
Each timeframe produces its own set of minimum, maximum, and close SRSI values.
These are then combined and normalized to a 0–100 scale.
3. Normalization and Channel Plot
The combined results create three main lines:
Min Line (Green–Red gradient) → represents oversold strength
Max Line (Green–Red gradient) → represents overbought strength
Close Line (White) → represents average SRSI value
The area between the Min and Max lines is filled with a color gradient to form the SRSI Channel, visually showing momentum strength and range.
4. Signal & Alerts
Two alert levels are defined:
Alert Min Level → Default = 5 (oversold)
Alert Max Level → Default = 95 (overbought)
When:
oranmin ≤ Alert Min Level → Market is in an oversold state (potential reversal up).
oranmax ≥ Alert Max Level → Market is in an overbought state (potential reversal down).
When either of these thresholds is crossed, the indicator triggers:
A white square marker on the chart.
A custom alert with the message:
“SRSI Channel reached alert threshold (oranmax ≥ MaxLevel or oranmin ≤ MinLevel)”
🧭 How to Use It
🪄 Step 1 — Add to Chart
Copy the code into a new Pine Script in TradingView.
Click Add to chart.
You’ll see three lines and a colored channel between them.
⚙️ Step 2 — Adjust Inputs
Core SRSI Settings
Setting Description
K, D Smoothing factors for Stochastic RSI.
RSI Length Number of bars for RSI calculation.
S Length Period used for %K in Stochastic RSI.
Alert Min/Max Level Defines oversold/overbought zones.
Multi-Timeframe Settings
Change Time 1 to Time 4 to suit your trading style:
Shorter timeframes → faster but more noise.
Longer timeframes → smoother, more reliable momentum.
📈 Step 3 — Interpret the Chart
Indicator Element Meaning
🟩 Lower Boundary (Min) Lowest SRSI reading → momentum weakness / possible rebound area
🟥 Upper Boundary (Max) Highest SRSI reading → strong momentum / possible exhaustion
⚪ Middle Line (Close) Average of all SRSI readings → overall momentum strength
🌈 Channel Fill Visualizes balance between overbought and oversold levels
When the channel widens → market volatility and strength increase.
When it narrows → consolidation or low-momentum phase.
🔔 Step 4 — Alerts
You can create alerts using:
Condition: SRSI Extreme
Message: SRSI Channel reached alert threshold
Use this to receive notifications when the market hits extreme momentum levels (great for reversal traders).
💡 Trading Tips
✅ Combine with Supertrend, MACD, or Moving Averages for confirmation.
✅ Look for SRSI extremes aligning with price support/resistance for stronger reversal entries.
✅ Use different timeframe combinations (e.g., 1H–4H–12H–1D) depending on your trading style.
✅ Treat it as a momentum filter — not a direct buy/sell signal tool.
⚖️ Summary
The GP – SRSI Channel is a sophisticated multi-timeframe momentum indicator that helps traders visualize market strength and identify overbought or oversold conditions with exceptional clarity.
Features:
4 price sources × 4 timeframes = deep momentum insight
Dynamic, color-coded SRSI channel
Built-in alert system for extreme conditions
Clean and intuitive visual design
Best suited for:
Swing and position traders
Traders who use RSI/Stoch indicators
Those seeking to confirm entries with multi-timeframe momentum data
🎯 Understand the market’s true momentum — before it moves.
Mã nguồn mở
Theo đúng tinh thần TradingView, người tạo ra tập lệnh này đã biến tập lệnh thành mã nguồn mở để các nhà giao dịch có thể xem xét và xác minh công năng. Xin dành lời khen tặng cho tác giả! Mặc dù bạn có thể sử dụng miễn phí, nhưng lưu ý nếu đăng lại mã, bạn phải tuân theo Quy tắc nội bộ của chúng tôi.
Thông báo miễn trừ trách nhiệm
Thông tin và ấn phẩm không có nghĩa là và không cấu thành, tài chính, đầu tư, kinh doanh, hoặc các loại lời khuyên hoặc khuyến nghị khác được cung cấp hoặc xác nhận bởi TradingView. Đọc thêm trong Điều khoản sử dụng.