OPEN-SOURCE SCRIPT
Moving Average Reversals [QuantVue]
Moving Average Reversals [AlgoBuddy]
Description:
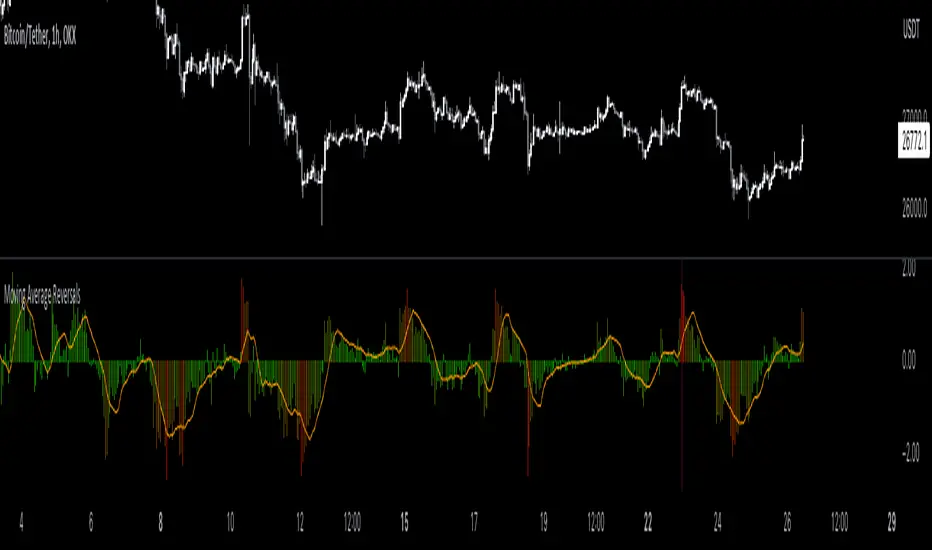
The Moving Average Reversals indicator gives a quick visual representation of when a stock gets extended up or down from a user selected moving average.
The color of the histogram dynamically changes as price becomes extended or within it’s normal trading range.
The indicator also highlights the largest extensions over the past year or 252 bars if using intraday.
Lastly a simple moving average of the extensions is calculated and used to confirm a change of character.
Settings:
🔹Use different MA types - EMA, SMA, HMA, WMA, VWMA
🔹Adjustable MA length
🔹Change distance measurement source - open, close, high, low, hl2, hlc3, ohlc4, hlcc4
🔹Extension highlighting
🔹Toggle MA extensions
Don't hesitate to reach out with any questions or concerns. We hope you enjoy!
Cheers.
Description:
The Moving Average Reversals indicator gives a quick visual representation of when a stock gets extended up or down from a user selected moving average.
The color of the histogram dynamically changes as price becomes extended or within it’s normal trading range.
The indicator also highlights the largest extensions over the past year or 252 bars if using intraday.
Lastly a simple moving average of the extensions is calculated and used to confirm a change of character.
Settings:
🔹Use different MA types - EMA, SMA, HMA, WMA, VWMA
🔹Adjustable MA length
🔹Change distance measurement source - open, close, high, low, hl2, hlc3, ohlc4, hlcc4
🔹Extension highlighting
🔹Toggle MA extensions
Don't hesitate to reach out with any questions or concerns. We hope you enjoy!
Cheers.
Mã nguồn mở
Theo đúng tinh thần TradingView, tác giả của tập lệnh này đã công bố nó dưới dạng mã nguồn mở, để các nhà giao dịch có thể xem xét và xác minh chức năng. Chúc mừng tác giả! Mặc dù bạn có thể sử dụng miễn phí, hãy nhớ rằng việc công bố lại mã phải tuân theo Nội quy.
Get Access to the exclusive QuantVue indicators: quantvue.io/
Join thousands of traders in our Free Discord: discord.gg/tC7u7magU3
Join thousands of traders in our Free Discord: discord.gg/tC7u7magU3
Thông báo miễn trừ trách nhiệm
Thông tin và các ấn phẩm này không nhằm mục đích, và không cấu thành, lời khuyên hoặc khuyến nghị về tài chính, đầu tư, giao dịch hay các loại khác do TradingView cung cấp hoặc xác nhận. Đọc thêm tại Điều khoản Sử dụng.