OPEN-SOURCE SCRIPT
MFI Multi-Timeframe
The Money Flow Index (MFI) is an oscillating momentum and market strength indicator that was developed by Gene Quong and Avrum Soudack. It is also a leading indicator, which means it tends to lead price action, and is similar in calculation as J. Welles Wilder's Relative Strength Index (RSI) with the significant difference being that the MFI uses both price and volume. Like the RSI, the MFI is a range-bound oscillator that oscillates between zero and 100 and is interpreted in a similar way as the RSI. The ultimate aim of the MFI is to determine whether money is flowing in or out of a security over a specified look-back period.
HOW IS IT USED ?
The MFI oscillates between 0 and 100 and a security is considered overbought when its MFI rises above 80 and oversold when its MFI falls below 20. These levels are the suggested overbought and oversold levels as suggested by Quong and Soudack, though they do not suggest these levels as entry signals. Instead, these caution levels warn that the price action and the current trend have reached extremes that may be unsustainable. Quong and Soudack also recommend using the 90 and 10 lines as truly overbought and truly oversold levels respectively. MFI movements above 90 and below 10 are rare and indicate a higher level of unsustainability.
Finally, failure swings from the 20 or 80 levels can also be used to identify potential price reversals and trade entries. A failure swing occurs when the MFI moves over the overbought or oversold level but reverses back before reaching the opposite level. Thus, when the MFI crosses up over the 20 (oversold) level but reverses before it reaches the 80 (overbought) level, it indicates that the uptrend is weak and that it may reverse soon. This signals that you should cover any long positions or go short. Similarly, when the MFI crosses down over the 80 (overbought) level but reverses before it reaches the 20 (oversold) level, it indicates a weakness in the down trend and the probability that the trend will reverse. This would be a signal to close of any short positions; or a signal to long buy.
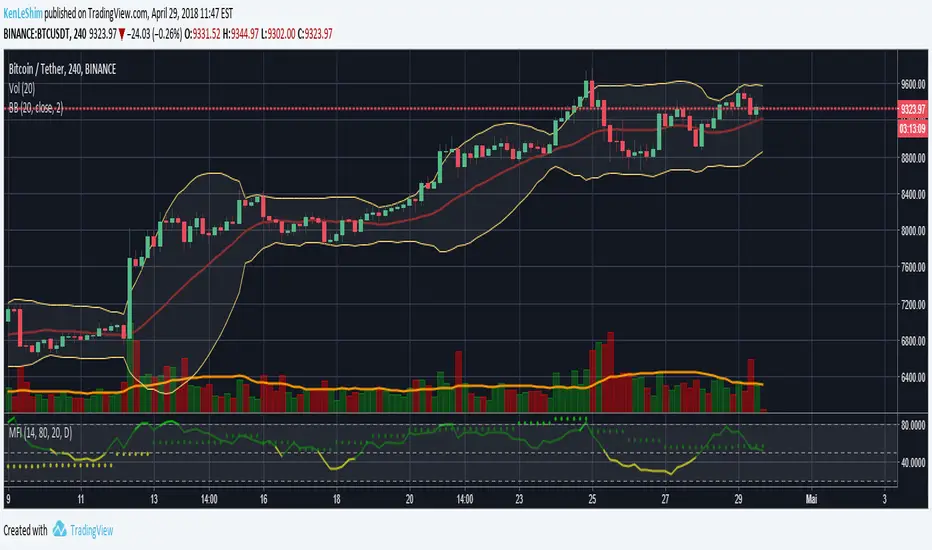
I added the possibility to add on the chart a 2nd timeframe for confirmation.
If you found this script useful, a tip is always welcome... :)
HOW IS IT USED ?
The MFI oscillates between 0 and 100 and a security is considered overbought when its MFI rises above 80 and oversold when its MFI falls below 20. These levels are the suggested overbought and oversold levels as suggested by Quong and Soudack, though they do not suggest these levels as entry signals. Instead, these caution levels warn that the price action and the current trend have reached extremes that may be unsustainable. Quong and Soudack also recommend using the 90 and 10 lines as truly overbought and truly oversold levels respectively. MFI movements above 90 and below 10 are rare and indicate a higher level of unsustainability.
Finally, failure swings from the 20 or 80 levels can also be used to identify potential price reversals and trade entries. A failure swing occurs when the MFI moves over the overbought or oversold level but reverses back before reaching the opposite level. Thus, when the MFI crosses up over the 20 (oversold) level but reverses before it reaches the 80 (overbought) level, it indicates that the uptrend is weak and that it may reverse soon. This signals that you should cover any long positions or go short. Similarly, when the MFI crosses down over the 80 (overbought) level but reverses before it reaches the 20 (oversold) level, it indicates a weakness in the down trend and the probability that the trend will reverse. This would be a signal to close of any short positions; or a signal to long buy.
I added the possibility to add on the chart a 2nd timeframe for confirmation.
If you found this script useful, a tip is always welcome... :)
Mã nguồn mở
Theo đúng tinh thần TradingView, tác giả của tập lệnh này đã công bố nó dưới dạng mã nguồn mở, để các nhà giao dịch có thể xem xét và xác minh chức năng. Chúc mừng tác giả! Mặc dù bạn có thể sử dụng miễn phí, hãy nhớ rằng việc công bố lại mã phải tuân theo Nội quy.
Thông báo miễn trừ trách nhiệm
Thông tin và các ấn phẩm này không nhằm mục đích, và không cấu thành, lời khuyên hoặc khuyến nghị về tài chính, đầu tư, giao dịch hay các loại khác do TradingView cung cấp hoặc xác nhận. Đọc thêm tại Điều khoản Sử dụng.