OPEN-SOURCE SCRIPT
Overnight High/Low
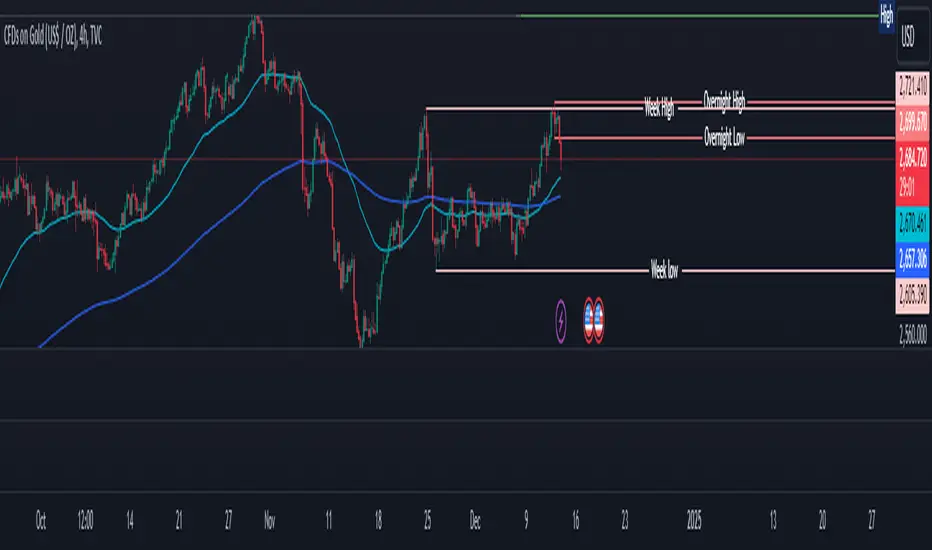
The script identifies the Overnight High (the highest price) and Overnight Low (the lowest price) for a trading instrument during a specified overnight session. It then plots these levels on the chart for reference in subsequent trading sessions.
Key Features:
Time Settings:
The script defines the start (startHour) and end (endHour + endMinute) times for the overnight session.
The session spans across two calendar days, such as 5:00 PM (17:00) to 9:30 AM (09:30).
Tracking High and Low:
During the overnight session, the script dynamically tracks:
Overnight High: The highest price reached during the session.
Overnight Low: The lowest price reached during the session.
Reset Mechanism:
After the overnight session ends (at the specified end time), the script resets the overnightHigh and overnightLow variables, preparing for the next session.
Visual Representation:
The script uses horizontal dotted lines to plot:
A green line for the Overnight High.
A red line for the Overnight Low.
These lines extend to the right of the chart, providing visual reference points for traders.
How It Works:
Session Detection:
The script checks whether the current time falls within the overnight session:
If the hour is greater than or equal to the start hour (e.g., 17:00).
Or if the hour is less than or equal to the end hour (e.g., 09:30), considering the next day.
The end minute (e.g., 30 minutes past the hour) is also considered for precision.
High and Low Calculation:
During the overnight session:
If the overnightHigh is not yet defined, it initializes with the current candle's high.
If already defined, it updates by comparing the current candle's high to the existing overnightHigh using the math.max function.
Similarly, overnightLow is initialized or updated using the math.min function.
Post-Session Reset:
After the session ends, the script clears the overnightHigh and overnightLow variables by setting them to na (not available).
Line Drawing:
The script draws horizontal dotted lines for the Overnight High and Low during and after the session.
The lines extend indefinitely to the right of the chart.
Benefits:
Visual Aid: Helps traders quickly identify overnight support and resistance levels, which are critical for intraday trading.
Automation: Removes the need for manually plotting these levels each day.
Customizable: Time settings can be adjusted to match different markets or trading strategies.
This script is ideal for traders who use the overnight range as part of their analysis for breakouts, reversals, or trend continuation strategies.
Mã nguồn mở
Theo đúng tinh thần TradingView, tác giả của tập lệnh này đã công bố nó dưới dạng mã nguồn mở, để các nhà giao dịch có thể xem xét và xác minh chức năng. Chúc mừng tác giả! Mặc dù bạn có thể sử dụng miễn phí, hãy nhớ rằng việc công bố lại mã phải tuân theo Nội quy.
Thông báo miễn trừ trách nhiệm
Thông tin và các ấn phẩm này không nhằm mục đích, và không cấu thành, lời khuyên hoặc khuyến nghị về tài chính, đầu tư, giao dịch hay các loại khác do TradingView cung cấp hoặc xác nhận. Đọc thêm tại Điều khoản Sử dụng.