OPEN-SOURCE SCRIPT
Aura Vibes EMA Ribbon + VStop + SAR + Bollinger Bands
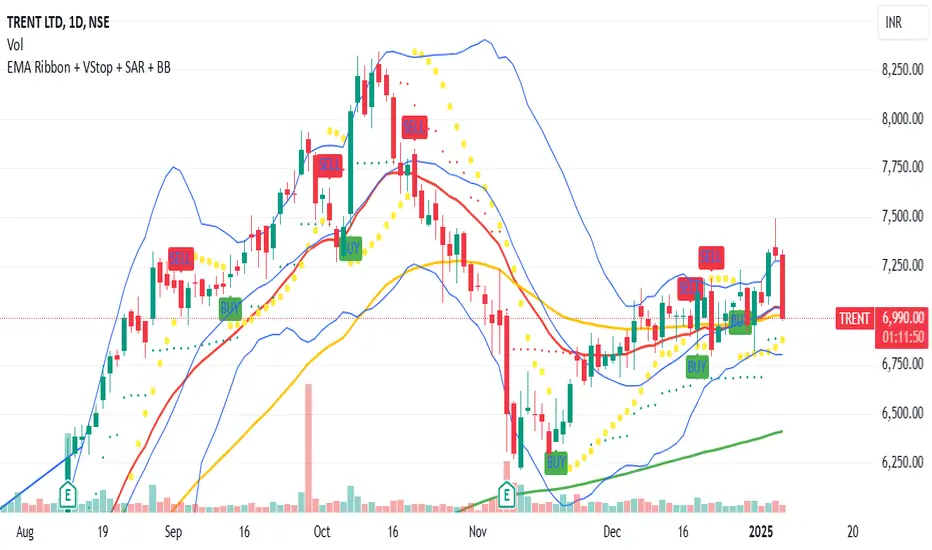
The combination of Exponential Moving Averages (EMA), Volatility Stop (VStop), Parabolic SAR (PSAR), and Bollinger Bands (BB) offers a comprehensive approach to technical analysis, each serving a distinct purpose:
Exponential Moving Averages (EMA): EMAs are used to identify the direction of the trend by smoothing price data. Shorter-period EMAs react more quickly to price changes, while longer-period EMAs provide a broader view of the trend.
Volatility Stop (VStop): VStop is a dynamic stop-loss mechanism that adjusts based on market volatility, typically using the Average True Range (ATR). This allows traders to set stop-loss levels that accommodate market fluctuations, potentially reducing the likelihood of premature stop-outs.
Parabolic SAR (PSAR): PSAR is a trend-following indicator that provides potential entry and exit points by plotting dots above or below the price chart. When the dots are below the price, it suggests an uptrend; when above, a downtrend.
Bollinger Bands (BB): BB consists of a middle band (typically a 20-period simple moving average) and two outer bands set at standard deviations above and below the middle band. These bands expand and contract based on market volatility, helping traders identify overbought or oversold conditions.
Integrating these indicators can enhance trading strategies:
Trend Identification: Use EMAs to determine the prevailing market trend. For instance, a short-term EMA crossing above a long-term EMA may signal an uptrend.
Entry and Exit Points: Combine PSAR and BB to pinpoint potential entry and exit points. For example, a PSAR dot appearing below the price during an uptrend, coinciding with the price touching the lower Bollinger Band, might indicate a buying opportunity.
Risk Management: Implement VStop to set adaptive stop-loss levels that adjust with market volatility, providing a buffer against market noise.
By thoughtfully combining these indicators, traders can develop a robust trading system that adapts to various market conditions.
Mã nguồn mở
Theo đúng tinh thần TradingView, tác giả của tập lệnh này đã công bố nó dưới dạng mã nguồn mở, để các nhà giao dịch có thể xem xét và xác minh chức năng. Chúc mừng tác giả! Mặc dù bạn có thể sử dụng miễn phí, hãy nhớ rằng việc công bố lại mã phải tuân theo Nội quy.
Thông báo miễn trừ trách nhiệm
Thông tin và các ấn phẩm này không nhằm mục đích, và không cấu thành, lời khuyên hoặc khuyến nghị về tài chính, đầu tư, giao dịch hay các loại khác do TradingView cung cấp hoặc xác nhận. Đọc thêm tại Điều khoản Sử dụng.