OPEN-SOURCE SCRIPT
Volume + Volatility
Before I begin I want to mention:
1. This is a variation of the 'CCI & BB' made by matsu_bitmex (Link: tradingview.com/script/IkciCgbh/) and SigmaDraconis's 'On Balance Volume Oscillator + Bollinger Bands' (Link: tradingview.com/script/0MbvTUui-On-Balance-Volume-Oscillator-Bollinger-Bands-SigmaDraconis/)
2. While using this sometimes you may not notice the crossover so I've added the Line 'x' outside 'x' BB to only see if Line 3 and 4 crossed over
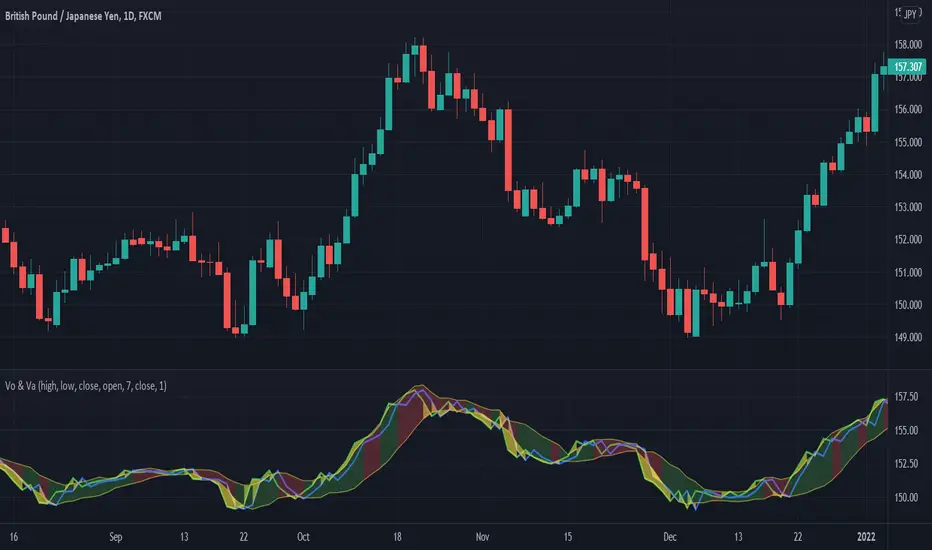
The indicator:
1. When the background is green and the 2 lines are going up it means uptrend
2. When the background is red and the 2 lines are going down it means downtrend
3. When there is a crossover and the background outside BB turns yellow, it means there is a lot of volatility or volume
How to use (Or how I use this):
1. All trades based on the yellow color MUST be during a trend
2. When the color changes to yellow for the 1st time in the direction of a trend it is advisable to enter
1. This is a variation of the 'CCI & BB' made by matsu_bitmex (Link: tradingview.com/script/IkciCgbh/) and SigmaDraconis's 'On Balance Volume Oscillator + Bollinger Bands' (Link: tradingview.com/script/0MbvTUui-On-Balance-Volume-Oscillator-Bollinger-Bands-SigmaDraconis/)
2. While using this sometimes you may not notice the crossover so I've added the Line 'x' outside 'x' BB to only see if Line 3 and 4 crossed over
The indicator:
1. When the background is green and the 2 lines are going up it means uptrend
2. When the background is red and the 2 lines are going down it means downtrend
3. When there is a crossover and the background outside BB turns yellow, it means there is a lot of volatility or volume
How to use (Or how I use this):
1. All trades based on the yellow color MUST be during a trend
2. When the color changes to yellow for the 1st time in the direction of a trend it is advisable to enter
Mã nguồn mở
Theo đúng tinh thần TradingView, tác giả của tập lệnh này đã công bố nó dưới dạng mã nguồn mở, để các nhà giao dịch có thể xem xét và xác minh chức năng. Chúc mừng tác giả! Mặc dù bạn có thể sử dụng miễn phí, hãy nhớ rằng việc công bố lại mã phải tuân theo Nội quy.
Thông báo miễn trừ trách nhiệm
Thông tin và các ấn phẩm này không nhằm mục đích, và không cấu thành, lời khuyên hoặc khuyến nghị về tài chính, đầu tư, giao dịch hay các loại khác do TradingView cung cấp hoặc xác nhận. Đọc thêm tại Điều khoản Sử dụng.