OPEN-SOURCE SCRIPT
OHLC Tool
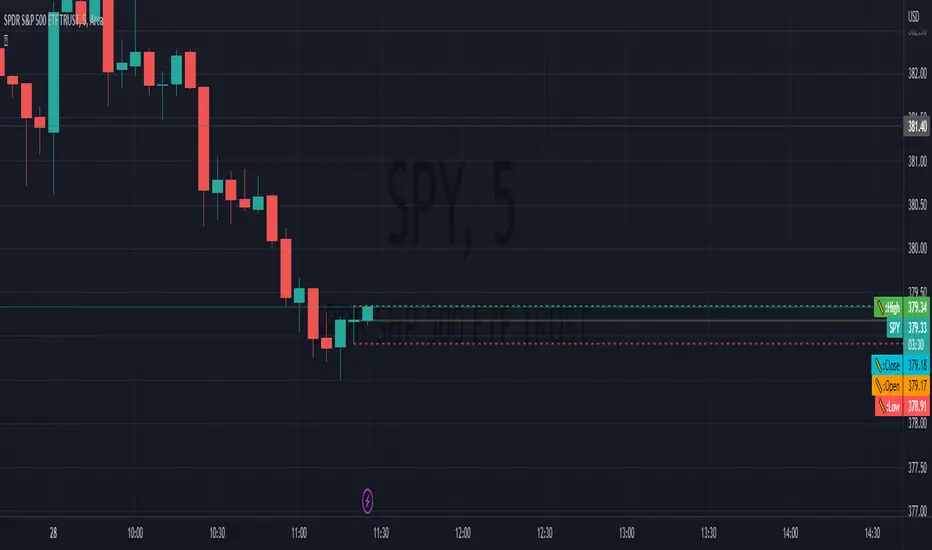
OHLC Tool allows you to display Current or Historical OHLC Values as horizontal lines that extend to the right on your chart.
Features
For displaying the line values and labels on the price scale you will need to enable:
"Indicator and financials name labels"
and
"Indicator and financials value labels"
When you do this you will notice your other indicator values will also be on the price scale,
if you wish to disable these, go to the indicator settings under the "Style" Tab, Uncheck the "Labels on price scale" box.
Indicator Settings > Style > "Labels on price scale"
Enjoy!
Features
- Variable Lookback to display a specific historical bar's values. Default = 1 (Previous Candle)
- Customizable Timeframe to view HTF Candle values.
- Custom Line Colors, Styles, and Thicknesses.
- Price Scale Value Display Capability.
For displaying the line values and labels on the price scale you will need to enable:
"Indicator and financials name labels"
and
"Indicator and financials value labels"
- These options are found in the Price Scale Menu under Labels. Price Scale Menu > Labels
When you do this you will notice your other indicator values will also be on the price scale,
if you wish to disable these, go to the indicator settings under the "Style" Tab, Uncheck the "Labels on price scale" box.
Indicator Settings > Style > "Labels on price scale"
Enjoy!
Mã nguồn mở
Theo tinh thần TradingView thực sự, tác giả của tập lệnh này đã xuất bản dưới dạng nguồn mở để các nhà giao dịch có thể hiểu và xác minh. Chúc mừng tác giả! Bạn có thể sử dụng miễn phí. Tuy nhiên, bạn cần sử dụng lại mã này theo Quy tắc nội bộ. Bạn có thể yêu thích nó để sử dụng nó trên biểu đồ.
Thông báo miễn trừ trách nhiệm
Thông tin và ấn phẩm không có nghĩa là và không cấu thành, tài chính, đầu tư, kinh doanh, hoặc các loại lời khuyên hoặc khuyến nghị khác được cung cấp hoặc xác nhận bởi TradingView. Đọc thêm trong Điều khoản sử dụng.