OPEN-SOURCE SCRIPT
Indicator: Derivative Oscillator
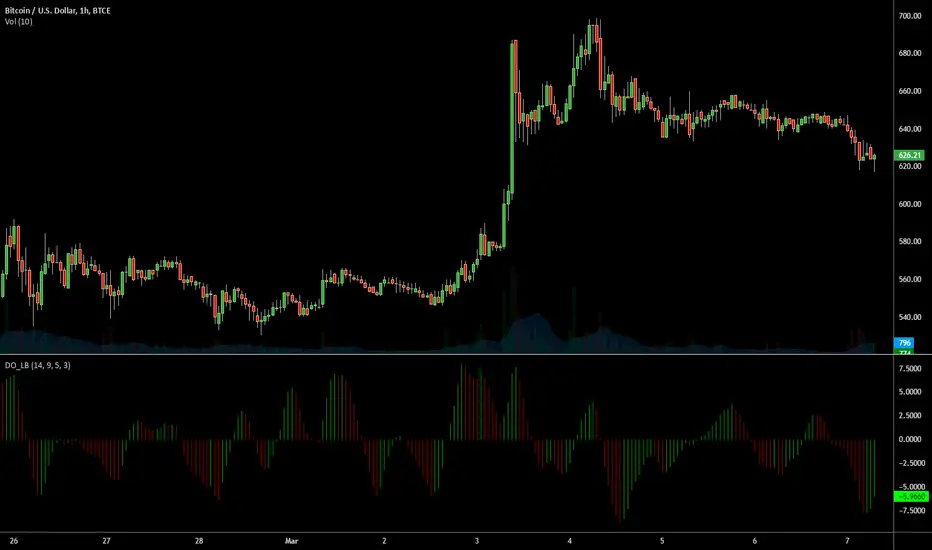
Constance Brown's Derivative Oscillator was published in her book "Technical Analysis for the Trading Professional".
The oscillator uses a 14-period RSI. The RSI is then double smoothed with exponential moving averages. The default settings for the smoothing periods are 5 and 3.
In a second step a signal line is generated from the smoothed RSI by calculating a simple moving average with a period of 9.
The Derivative Oscillator is calculated as the difference between the smoothed RSI and the signal line and displayed as histogram.
All the values are configurable.
Mã nguồn mở
Theo đúng tinh thần TradingView, tác giả của tập lệnh này đã công bố nó dưới dạng mã nguồn mở, để các nhà giao dịch có thể xem xét và xác minh chức năng. Chúc mừng tác giả! Mặc dù bạn có thể sử dụng miễn phí, hãy nhớ rằng việc công bố lại mã phải tuân theo Nội quy.
List of my free indicators: bit.ly/1LQaPK8
List of my indicators at Appstore: blog.tradingview.com/?p=970
List of my indicators at Appstore: blog.tradingview.com/?p=970
Thông báo miễn trừ trách nhiệm
Thông tin và các ấn phẩm này không nhằm mục đích, và không cấu thành, lời khuyên hoặc khuyến nghị về tài chính, đầu tư, giao dịch hay các loại khác do TradingView cung cấp hoặc xác nhận. Đọc thêm tại Điều khoản Sử dụng.