OPEN-SOURCE SCRIPT
Prime, E & PI Superiority Cycles
If you have been studying the markets long enough you will probably have noticed a certain pattern. Whichever trade entry/exit logic you try to use, it will go through phases of working really well and phases where it doesn't work at all. This is the markets way of ensuring anyone who sticks to an oversimplified, one-dimensional strategy will not profit. Superiority cycles are a method I devised by which code interrogates the nature of where price has been pivoting in relation to three key structures, the Prime Frame, E Frame and Pi Frame which are plotted as horizontal lines at these values:
* Use script on 1 minute chart ONLY
prime numbers up to 100: 2.0,3.0,5.0,7.0,11.0,13.0,17.0,19.0,23.0,27.0,29.0,31.0,37.0,41.0,43.0,47.0,53.0,59.0,61.0,67.0,71.0,73.0,79.0,83.0,89.0,97.0
multiples of e up to 100: 2.71828, 5.43656, 8.15484, 10.87312, 13.5914, 16.30968, 19.02796, 21.74624, 24.46452, 27.1828, 29.90108, 32.61936, 35.33764,
38.05592, 40.7742, 43.49248, 46.21076, 48.92904, 51.64732, 54.3656, 57.08388, 59.80216, 62.52044, 65.23872, 67.957, 70.67528, 73.39356000000001, 76.11184,
78.83012, 81.5484, 84.26668000000001, 86.98496, 89.70324, 92.42152, 95.13980000000001, 97.85808
multiples of pi up to 100: 3.14159, 6.28318, 9.424769999999999, 12.56636, 15.70795, 18.849539999999998, 21.99113, 25.13272, 28.27431, 31.4159, 34.55749,
37.699079999999995, 40.840669999999996, 43.98226, 47.12385, 50.26544, 53.40703, 56.54862, 59.69021, 62.8318, 65.97339, 69.11498, 72.25657, 75.39815999999999,
78.53975, 81.68133999999999, 84.82293, 87.96452, 91.10611, 94.2477, 97.38929
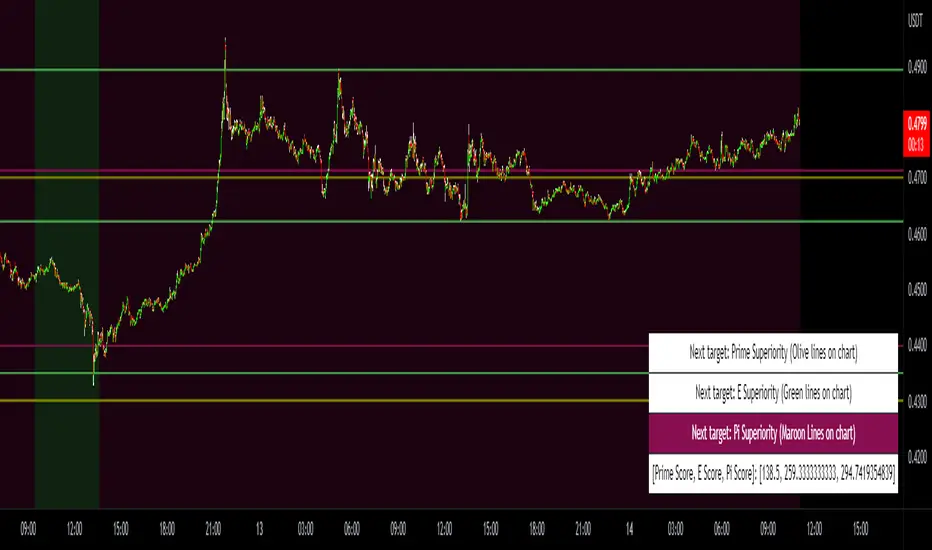
These values are iterated up the chart as seen below:

The script sums the distance of pivots to each of the respective frames (olive lines for Prime Frame, green lines for E Frame and maroon lines for Pi Frame) and determines which frame price has been reacting to in the least significant way. The worst performing frame is the next frame we target reversals at. The table in the bottom right will light up a color that corresponds to the frame color we should target.
Here is an example of Prime Superiority, where we prioritize trading from prime levels:

The table and the background color are both olive which means target prime levels. In an ideal world strong moves should start and finish where the white flags are placed i.e. in this case $17k and $19k. The reason these levels are 17,000 and 19,000 and not just 17 and 19 like in the original prime number sequence is due to the scaling code in the get_scale_func() which allows the code to operate on all assets.
This is E Superiority where we would hope to see major reversals at green lines:

This is Pi Superiority where we would hope to see major reversals at maroon lines:

And finally I would like to show you a market moving from one superiority to another. This can be observed by the bgcolor which tells us what the superiority was at every historical minute
Pi Frame Superiority into E Frame Superiority example:

Prime Frame Superiority into E Frame Superiority example:

Prime Frame Superiority into Pi Frame Superiority example:

By rotating the analysis we use to enter trades in this way we hope to hide our strategy better from market makers and artificial intelligence, and overall make greater profits.
* Use script on 1 minute chart ONLY
prime numbers up to 100: 2.0,3.0,5.0,7.0,11.0,13.0,17.0,19.0,23.0,27.0,29.0,31.0,37.0,41.0,43.0,47.0,53.0,59.0,61.0,67.0,71.0,73.0,79.0,83.0,89.0,97.0
multiples of e up to 100: 2.71828, 5.43656, 8.15484, 10.87312, 13.5914, 16.30968, 19.02796, 21.74624, 24.46452, 27.1828, 29.90108, 32.61936, 35.33764,
38.05592, 40.7742, 43.49248, 46.21076, 48.92904, 51.64732, 54.3656, 57.08388, 59.80216, 62.52044, 65.23872, 67.957, 70.67528, 73.39356000000001, 76.11184,
78.83012, 81.5484, 84.26668000000001, 86.98496, 89.70324, 92.42152, 95.13980000000001, 97.85808
multiples of pi up to 100: 3.14159, 6.28318, 9.424769999999999, 12.56636, 15.70795, 18.849539999999998, 21.99113, 25.13272, 28.27431, 31.4159, 34.55749,
37.699079999999995, 40.840669999999996, 43.98226, 47.12385, 50.26544, 53.40703, 56.54862, 59.69021, 62.8318, 65.97339, 69.11498, 72.25657, 75.39815999999999,
78.53975, 81.68133999999999, 84.82293, 87.96452, 91.10611, 94.2477, 97.38929
These values are iterated up the chart as seen below:
The script sums the distance of pivots to each of the respective frames (olive lines for Prime Frame, green lines for E Frame and maroon lines for Pi Frame) and determines which frame price has been reacting to in the least significant way. The worst performing frame is the next frame we target reversals at. The table in the bottom right will light up a color that corresponds to the frame color we should target.
Here is an example of Prime Superiority, where we prioritize trading from prime levels:
The table and the background color are both olive which means target prime levels. In an ideal world strong moves should start and finish where the white flags are placed i.e. in this case $17k and $19k. The reason these levels are 17,000 and 19,000 and not just 17 and 19 like in the original prime number sequence is due to the scaling code in the get_scale_func() which allows the code to operate on all assets.
This is E Superiority where we would hope to see major reversals at green lines:
This is Pi Superiority where we would hope to see major reversals at maroon lines:
And finally I would like to show you a market moving from one superiority to another. This can be observed by the bgcolor which tells us what the superiority was at every historical minute
Pi Frame Superiority into E Frame Superiority example:
Prime Frame Superiority into E Frame Superiority example:
Prime Frame Superiority into Pi Frame Superiority example:
By rotating the analysis we use to enter trades in this way we hope to hide our strategy better from market makers and artificial intelligence, and overall make greater profits.
Mã nguồn mở
Theo đúng tinh thần TradingView, tác giả của tập lệnh này đã công bố nó dưới dạng mã nguồn mở, để các nhà giao dịch có thể xem xét và xác minh chức năng. Chúc mừng tác giả! Mặc dù bạn có thể sử dụng miễn phí, hãy nhớ rằng việc công bố lại mã phải tuân theo Nội quy.
Thông báo miễn trừ trách nhiệm
Thông tin và các ấn phẩm này không nhằm mục đích, và không cấu thành, lời khuyên hoặc khuyến nghị về tài chính, đầu tư, giao dịch hay các loại khác do TradingView cung cấp hoặc xác nhận. Đọc thêm tại Điều khoản Sử dụng.