OPEN-SOURCE SCRIPT
Andean Oscillator (Version 3.0 Sr.K)
Andean Oscillator (Version 3.0 Sr.K)
This indicator is a momentum-based oscillator that measures the balance between bullish and bearish pressure.
🔧 How it works:
It calculates two adaptive envelopes around price and derives a "bullish" and "bearish" component.
The oscillator value is simply Bull - Bear, showing which side dominates.
A signal line (EMA of the oscillator) smooths the raw value.
Optionally, ±1σ levels are plotted to highlight statistically strong moves.
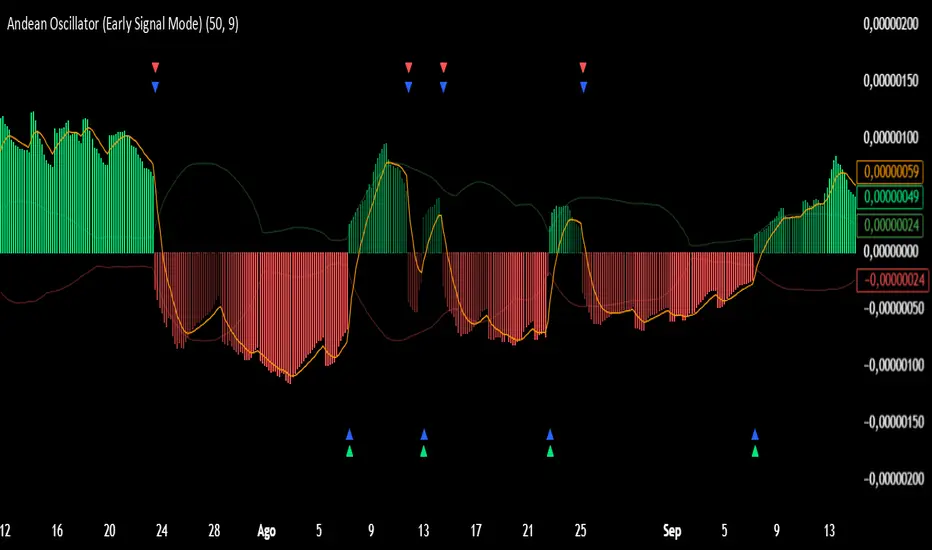
📊 What you see:
Histogram: Positive bars = bullish momentum, negative bars = bearish.
Orange Line: Signal line (EMA) used to confirm or anticipate reversals.
Zero Line: The equilibrium point. Crosses of this level signal a shift in market bias.
Green / Red Triangles: Buy and sell signals, either when crossing zero or crossing the signal line (depending on selected mode).
⚡ Early Signal Mode:
When enabled, signals trigger earlier — at the crossover between the oscillator and its signal line — allowing traders to enter potential reversals before a full zero-cross confirmation.
✅ Use cases:
Identify momentum shifts before price reversals.
Spot potential long/short setups with reduced lag.
Combine with price action or support/resistance for confirmation.
⚠️ Note: This is a tool for discretionary/manual trading. It does not open or close trades automatically. Always confirm with your own analysis and risk management.
This indicator is a momentum-based oscillator that measures the balance between bullish and bearish pressure.
🔧 How it works:
It calculates two adaptive envelopes around price and derives a "bullish" and "bearish" component.
The oscillator value is simply Bull - Bear, showing which side dominates.
A signal line (EMA of the oscillator) smooths the raw value.
Optionally, ±1σ levels are plotted to highlight statistically strong moves.
📊 What you see:
Histogram: Positive bars = bullish momentum, negative bars = bearish.
Orange Line: Signal line (EMA) used to confirm or anticipate reversals.
Zero Line: The equilibrium point. Crosses of this level signal a shift in market bias.
Green / Red Triangles: Buy and sell signals, either when crossing zero or crossing the signal line (depending on selected mode).
⚡ Early Signal Mode:
When enabled, signals trigger earlier — at the crossover between the oscillator and its signal line — allowing traders to enter potential reversals before a full zero-cross confirmation.
✅ Use cases:
Identify momentum shifts before price reversals.
Spot potential long/short setups with reduced lag.
Combine with price action or support/resistance for confirmation.
⚠️ Note: This is a tool for discretionary/manual trading. It does not open or close trades automatically. Always confirm with your own analysis and risk management.
Mã nguồn mở
Theo đúng tinh thần TradingView, tác giả của tập lệnh này đã công bố nó dưới dạng mã nguồn mở, để các nhà giao dịch có thể xem xét và xác minh chức năng. Chúc mừng tác giả! Mặc dù bạn có thể sử dụng miễn phí, hãy nhớ rằng việc công bố lại mã phải tuân theo Nội quy.
Thông báo miễn trừ trách nhiệm
Thông tin và các ấn phẩm này không nhằm mục đích, và không cấu thành, lời khuyên hoặc khuyến nghị về tài chính, đầu tư, giao dịch hay các loại khác do TradingView cung cấp hoặc xác nhận. Đọc thêm tại Điều khoản Sử dụng.