OPEN-SOURCE SCRIPT
Cập nhật Secondary Chart with OverSized Candles
Hi everyone, I'm sharing a simple script I made for a friend. He was looking for a way to add another asset to his chart, and monitor relevant movements \ spot eventual correlation, especially when trading Cryptocurrencies.
We couldn't find a similar script already available so here it is - the code is commented and I hope it's clear enough :)
Notes:
- The parameter scale = scale.left keeps the scales separated and therefore the chart is more organized, otherwise the chart would appear flat if the price difference is too big (e.g. BTC vs XRP)
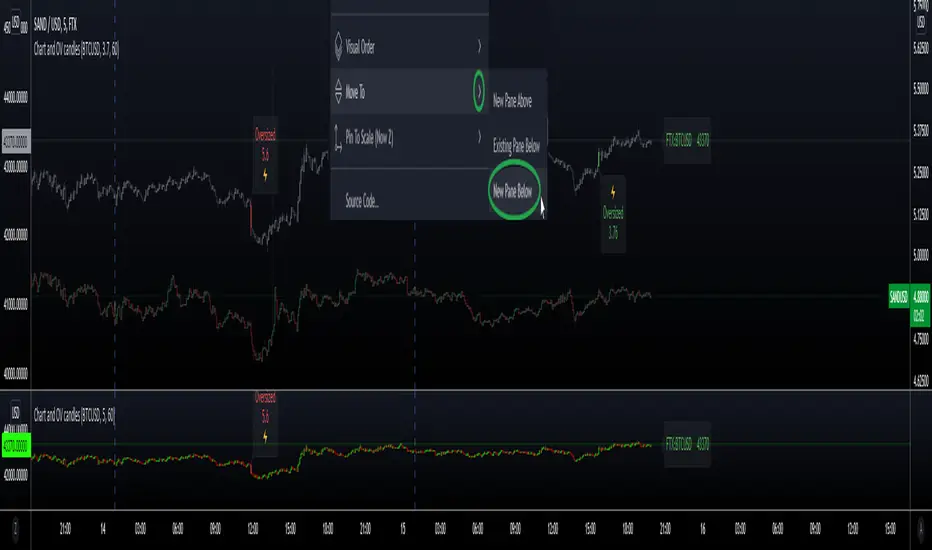
- It is possible to have the script running in a separate panel (instead of overlay) by moving it to a new pane (when added to the chart) or by removing the parameter overlay = true at the beginning of the code.
- In case you wish to add indicators to this sub-chart (e.g. Bollinger Bands, EMA, etc..) you can do that by adding the relevant code and feed it with the variables OPEN \ HIGH \ LOW \ CLOSE as well as using the same method to retrieve new variables from the target asset with the request.security function.
Hope this comes handy.
Val - Protervus
We couldn't find a similar script already available so here it is - the code is commented and I hope it's clear enough :)
Notes:
- The parameter scale = scale.left keeps the scales separated and therefore the chart is more organized, otherwise the chart would appear flat if the price difference is too big (e.g. BTC vs XRP)
- It is possible to have the script running in a separate panel (instead of overlay) by moving it to a new pane (when added to the chart) or by removing the parameter overlay = true at the beginning of the code.
- In case you wish to add indicators to this sub-chart (e.g. Bollinger Bands, EMA, etc..) you can do that by adding the relevant code and feed it with the variables OPEN \ HIGH \ LOW \ CLOSE as well as using the same method to retrieve new variables from the target asset with the request.security function.
Hope this comes handy.
Val - Protervus
Phát hành các Ghi chú
Added Price Line as per request (can be disabled in Settings)Phát hành các Ghi chú
Code-cleaning only.Phát hành các Ghi chú
Fixed the alert for Bearish OverSized CandleMã nguồn mở
Theo đúng tinh thần TradingView, tác giả của tập lệnh này đã công bố nó dưới dạng mã nguồn mở, để các nhà giao dịch có thể xem xét và xác minh chức năng. Chúc mừng tác giả! Mặc dù bạn có thể sử dụng miễn phí, hãy nhớ rằng việc công bố lại mã phải tuân theo Nội quy.
Thông báo miễn trừ trách nhiệm
Thông tin và các ấn phẩm này không nhằm mục đích, và không cấu thành, lời khuyên hoặc khuyến nghị về tài chính, đầu tư, giao dịch hay các loại khác do TradingView cung cấp hoặc xác nhận. Đọc thêm tại Điều khoản Sử dụng.
Mã nguồn mở
Theo đúng tinh thần TradingView, tác giả của tập lệnh này đã công bố nó dưới dạng mã nguồn mở, để các nhà giao dịch có thể xem xét và xác minh chức năng. Chúc mừng tác giả! Mặc dù bạn có thể sử dụng miễn phí, hãy nhớ rằng việc công bố lại mã phải tuân theo Nội quy.
Thông báo miễn trừ trách nhiệm
Thông tin và các ấn phẩm này không nhằm mục đích, và không cấu thành, lời khuyên hoặc khuyến nghị về tài chính, đầu tư, giao dịch hay các loại khác do TradingView cung cấp hoặc xác nhận. Đọc thêm tại Điều khoản Sử dụng.