OPEN-SOURCE SCRIPT
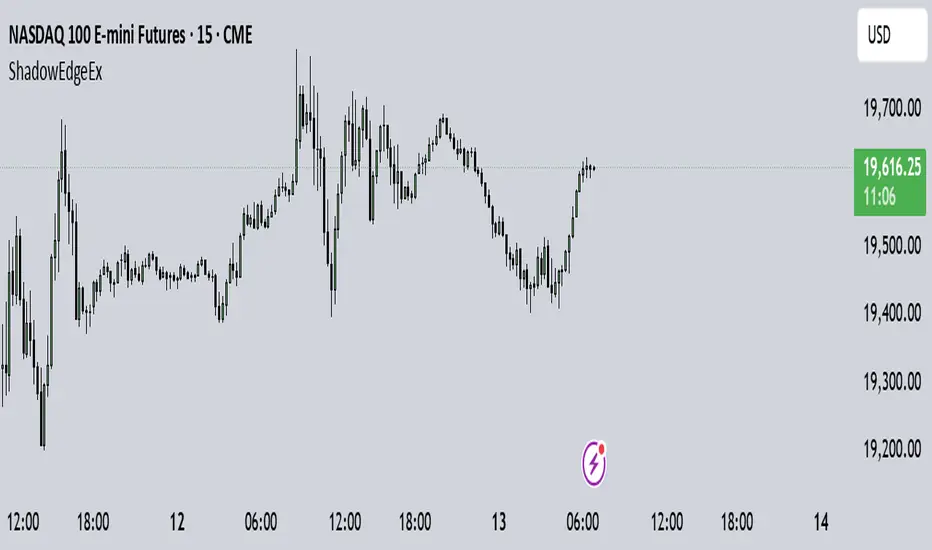
Shadow Edge (Example)

This script tracks hourly price extremes (highs/lows) and their equilibrium (midpoint), plotting them as dynamic reference lines on your chart. It helps visualize intraday support/resistance levels and potential price boundaries.
Key Features
Previous Hour Levels (Static Lines):
PH (Previous Hour High): Red line.
PL (Previous Hour Low): Green line.
P.EQ (Previous Hour Equilibrium): Blue midpoint between PH and PL.
Current Hour Levels (Dynamic/Dotted Lines):
MuEH (Current Hour High): Yellow dashed line (updates in real-time).
MuEL (Current Hour Low): Orange dashed line (updates in real-time).
Labels: Clear text labels on the right edge of the chart for easy readability.
How It Works
Hourly Tracking:
Detects new hours using the hour(time) function.
Resets high/low values at the start of each hour.
Stores the previous hour’s PH, PL, and P.EQ when a new hour begins.
Dynamic Updates:
Continuously updates MuEH and MuEL during the current hour to reflect the latest extremes.
Customization
Toggle visibility of lines via inputs:
Enable/disable PH, PL, P.EQ, MuEH, MuEL individually.
Adjustable colors and line styles (solid for previous hour, dashed for current hour).
Use Case
Intraday Traders: Identify hourly ranges, breakout/retracement opportunities, or mean-reversion setups.
Visual Reference: Quickly see where price is relative to recent hourly activity.
Technical Notes
Overlay: Plots directly on the price chart.
Efficiency: Uses var variables to preserve values between bars.
Labels: Only appear on the latest bar to avoid clutter.
This tool simplifies intraday price action analysis by combining historical and real-time hourly data into a single visual framework.
Mã nguồn mở
Theo đúng tinh thần TradingView, tác giả của tập lệnh này đã công bố nó dưới dạng mã nguồn mở, để các nhà giao dịch có thể xem xét và xác minh chức năng. Chúc mừng tác giả! Mặc dù bạn có thể sử dụng miễn phí, hãy nhớ rằng việc công bố lại mã phải tuân theo Nội quy.
Thông báo miễn trừ trách nhiệm
Thông tin và các ấn phẩm này không nhằm mục đích, và không cấu thành, lời khuyên hoặc khuyến nghị về tài chính, đầu tư, giao dịch hay các loại khác do TradingView cung cấp hoặc xác nhận. Đọc thêm tại Điều khoản Sử dụng.