OPEN-SOURCE SCRIPT
Smart MTF Bias Detector v3 (Debug)
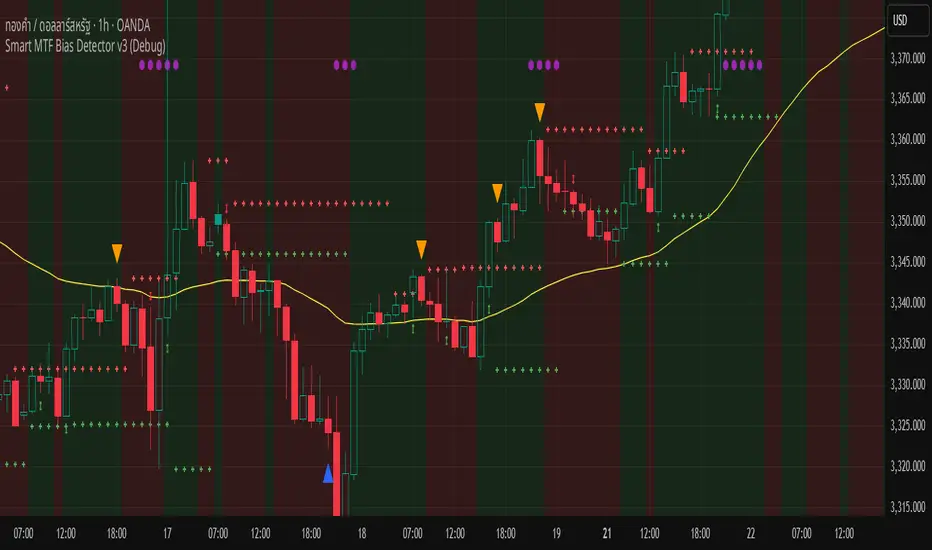
Here's a breakdown of the "Smart MTF Bias Detector v3 (Debug)" indicator's five main filters:
Main Trend (Multi-Timeframe Heikin Ashi)
The green/red background indicates the trend from Heikin Ashi candles on the H1 timeframe (or your set timeframe).
If the Heikin Ashi candle closes above its open, the background is green (indicating an upward bias).
If the Heikin Ashi candle closes below its open, the background is red (indicating a downward bias).
Short-Term Trend Filter (EMA50)
The yellow line represents the EMA50.
Buy only when the price closes above the EMA50.
Sell only when the price closes below the EMA50.
Abnormal Buy/Sell Pressure Detection (Volume Spike)
Purple dots signify candles where the volume is greater than the SMA (Simple Moving Average) of volume over N previous candles, multiplied by a specified multiplier.
This confirms there's "force" driving the price up or serious selling pressure.
Momentum Filter (Stochastic RSI)
Blue upward triangles and orange downward triangles indicate when %K crosses %D.
It uses Oversold/Overbought targets (20/80) to avoid crosses in the middle ranges.
Pivot Break (Fractal Breakout)
Red "X" marks represent Fractal Highs, and green "X" marks represent Fractal Lows.
Red/green up/down arrows indicate breakouts of these levels (e.g., a previous High being broken means an upward breakout, or a previous Low being broken means a downward breakout).
BUY Signal Conditions
A BUY signal will be generated when:
The background is green (HTF Trend ↑).
The Stoch RSI crosses up from below the Oversold zone (blue arrow).
A Fractal Low breakout occurs (Fract UP arrow).
The price is above the EMA50.
There is a Volume Spike (purple dot).
SELL Signal Conditions
A SELL signal will be generated when:
The background is red (HTF Trend ↓).
The Stoch RSI crosses down from above the Overbought zone (orange arrow).
A Fractal High breakout occurs (Fract DOWN arrow).
The price is below the EMA50.
There is a Volume Spike (purple dot).
Mã nguồn mở
Theo đúng tinh thần TradingView, người tạo ra tập lệnh này đã biến tập lệnh thành mã nguồn mở để các nhà giao dịch có thể xem xét và xác minh công năng. Xin dành lời khen tặng cho tác giả! Mặc dù bạn có thể sử dụng miễn phí, nhưng lưu ý nếu đăng lại mã, bạn phải tuân theo Quy tắc nội bộ của chúng tôi.
Thông báo miễn trừ trách nhiệm
Thông tin và ấn phẩm không có nghĩa là và không cấu thành, tài chính, đầu tư, kinh doanh, hoặc các loại lời khuyên hoặc khuyến nghị khác được cung cấp hoặc xác nhận bởi TradingView. Đọc thêm trong Điều khoản sử dụng.