OPEN-SOURCE SCRIPT
%Bs
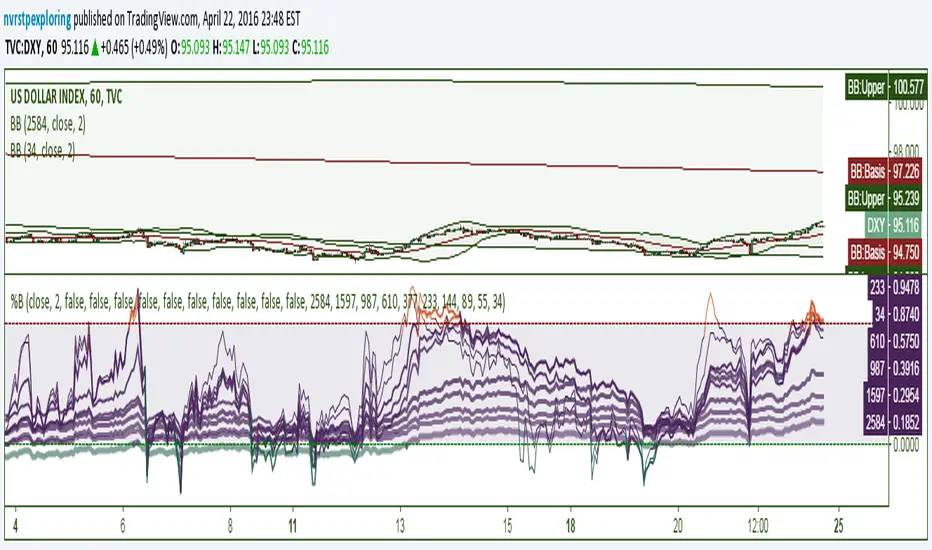
An indicator with 10 configurable %B lines for identifying trends, overbought and oversold conditions, and reversal points. %B is a linear representation of a securities relationship to the Upper and Lower Bollinger Bands. The best opportunities arise when a security is oversold in a bullish trend and overbought in a bearish trend. The longer %B trend-lines in this indicator are very useful for major reversals. They can be used to indicate the high or low of the day on a 1-minute chart or show a multi-year reversal point.
%B = (Current Price - Lower Band) / (Upper Band - Lower Band)
%B = (Current Price - Lower Band) / (Upper Band - Lower Band)
Mã nguồn mở
Theo đúng tinh thần TradingView, tác giả của tập lệnh này đã công bố nó dưới dạng mã nguồn mở, để các nhà giao dịch có thể xem xét và xác minh chức năng. Chúc mừng tác giả! Mặc dù bạn có thể sử dụng miễn phí, hãy nhớ rằng việc công bố lại mã phải tuân theo Nội quy.
Thông báo miễn trừ trách nhiệm
Thông tin và các ấn phẩm này không nhằm mục đích, và không cấu thành, lời khuyên hoặc khuyến nghị về tài chính, đầu tư, giao dịch hay các loại khác do TradingView cung cấp hoặc xác nhận. Đọc thêm tại Điều khoản Sử dụng.