OPEN-SOURCE SCRIPT
Approx STH Unrealized Profit [Relative %]
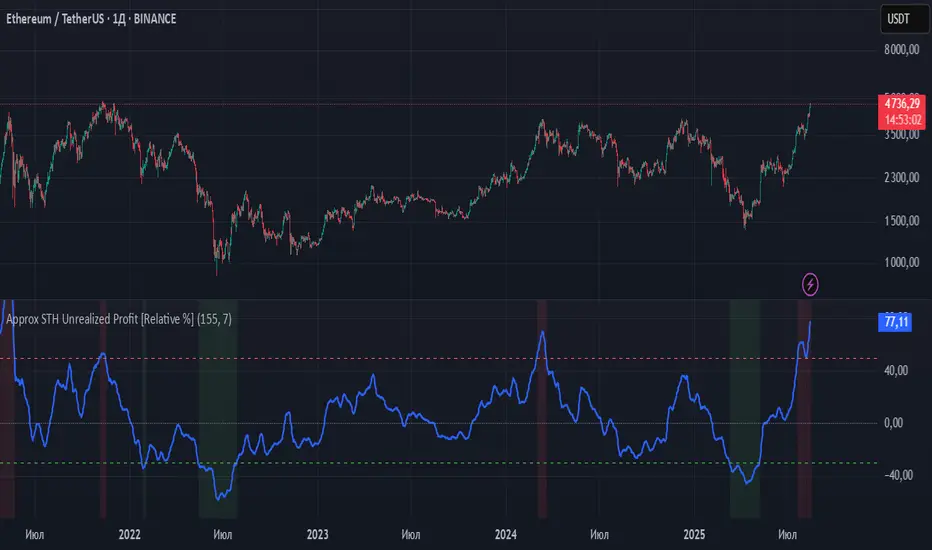
This indicator estimates the unrealized profit or loss of short-term holders (STH) without requiring on-chain data. Instead of using actual STH Realized Price (average purchase price), it employs a 155-day Simple Moving Average (SMA) to approximate the behavior of "recent buyers."
How It Works
The indicator calculates the percentage deviation between the current price and the 155-day SMA using the formula:
(Current Price - 155 SMA) / 155 SMA * 100%.
Positive values indicate profit, while negative values show loss. Key threshold levels are set at +50% (overbought) and -30% (oversold).
Trading Applications
Profit > 50% - STH are experiencing significant profits, suggesting potential correction. Consider taking partial profits.
0% < Profit < 50% - Moderate profits indicate the trend may continue. Maintain positions.
Profit ≈ 0% - Price is near STH's average entry point, showing market indecision.
-30% < Profit < 0% - STH are at a loss, potentially signaling accumulation opportunities.
Profit < -30% - Extreme oversold conditions may present buying opportunities.
Limitations
SMA only approximates STH behavior.
May produce false signals during sideways markets.
SMA lag can be noticeable in strong trending markets.
Recommendation
For improved accuracy, combine this indicator with trend-following tools (200 EMA, Volume analysis) and other technical indicators. It serves best as a supplementary tool for identifying overbought/oversold market conditions within your trading strategy.
Mã nguồn mở
Theo đúng tinh thần TradingView, người tạo ra tập lệnh này đã biến tập lệnh thành mã nguồn mở để các nhà giao dịch có thể xem xét và xác minh công năng. Xin dành lời khen tặng cho tác giả! Mặc dù bạn có thể sử dụng miễn phí, nhưng lưu ý nếu đăng lại mã, bạn phải tuân theo Quy tắc nội bộ của chúng tôi.
💡 Обсуждаем торговые идеи , делимся индикаторами и стратегиями в нашем Telegram-чате:
👉 t.me/+AQWwxRhhrXI0YTgy
👉 t.me/+AQWwxRhhrXI0YTgy
Thông báo miễn trừ trách nhiệm
Thông tin và ấn phẩm không có nghĩa là và không cấu thành, tài chính, đầu tư, kinh doanh, hoặc các loại lời khuyên hoặc khuyến nghị khác được cung cấp hoặc xác nhận bởi TradingView. Đọc thêm trong Điều khoản sử dụng.