OPEN-SOURCE SCRIPT
Cập nhật Relative Performance Table
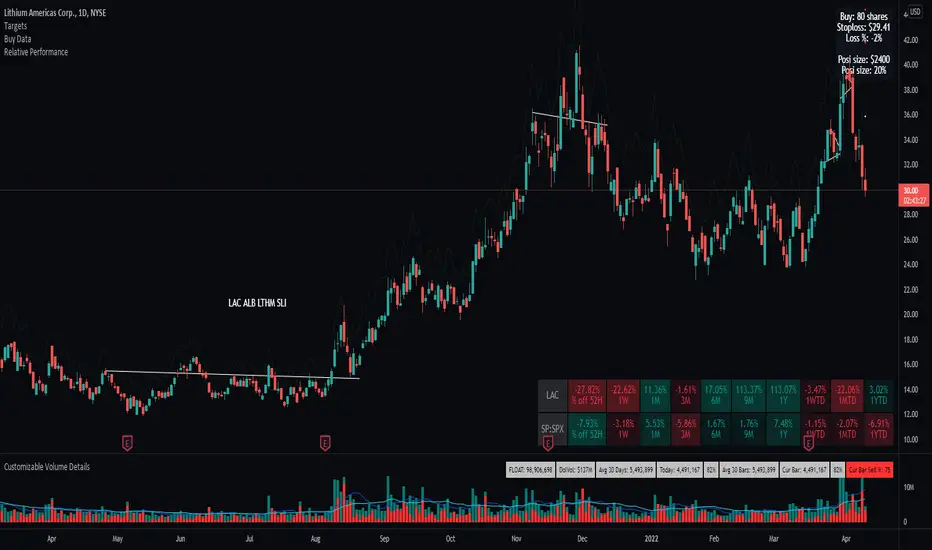
This indicator is based on the Performance section in the TradingView's sidebar and uses new Pine tables functionality, originally coded by @Beeholder. It compares the current price of the symbol to its past price and calculates the rate of return to make it easier to track the performance of the symbol. Note that the Performance sidebar is not updated in real-time, while this indicator is, so on real-time charts the values between the two can differ (the indicator's values are more recent). Made a number of enhancement from Bee's script including relative performance of a selected ticker, dynamic table columns, and other options.
The formula of the calculation is (Current value - Past value) * 100 / Past value, where Past value is:
--Future development will include the ability to transpose the table columns/rows
The formula of the calculation is (Current value - Past value) * 100 / Past value, where Past value is:
- 1W
- 1M
- 3M
- 6M
- 9M
- 52W (1 Year)
- WTD (Week to Date)
- MTD (Month to Date)
- YTD (Year to Date
--Future development will include the ability to transpose the table columns/rows
Phát hành các Ghi chú
--Minor fix to tooltipPhát hành các Ghi chú
Added 52 week high calculation to quickly screen whether a ticker is within 25% of the 52 week HighsMã nguồn mở
Theo đúng tinh thần TradingView, tác giả của tập lệnh này đã công bố nó dưới dạng mã nguồn mở, để các nhà giao dịch có thể xem xét và xác minh chức năng. Chúc mừng tác giả! Mặc dù bạn có thể sử dụng miễn phí, hãy nhớ rằng việc công bố lại mã phải tuân theo Nội quy.
Thông báo miễn trừ trách nhiệm
Thông tin và các ấn phẩm này không nhằm mục đích, và không cấu thành, lời khuyên hoặc khuyến nghị về tài chính, đầu tư, giao dịch hay các loại khác do TradingView cung cấp hoặc xác nhận. Đọc thêm tại Điều khoản Sử dụng.
Mã nguồn mở
Theo đúng tinh thần TradingView, tác giả của tập lệnh này đã công bố nó dưới dạng mã nguồn mở, để các nhà giao dịch có thể xem xét và xác minh chức năng. Chúc mừng tác giả! Mặc dù bạn có thể sử dụng miễn phí, hãy nhớ rằng việc công bố lại mã phải tuân theo Nội quy.
Thông báo miễn trừ trách nhiệm
Thông tin và các ấn phẩm này không nhằm mục đích, và không cấu thành, lời khuyên hoặc khuyến nghị về tài chính, đầu tư, giao dịch hay các loại khác do TradingView cung cấp hoặc xác nhận. Đọc thêm tại Điều khoản Sử dụng.