OPEN-SOURCE SCRIPT
EMA Trend with MACD-Based Bar Coloring (Customized)
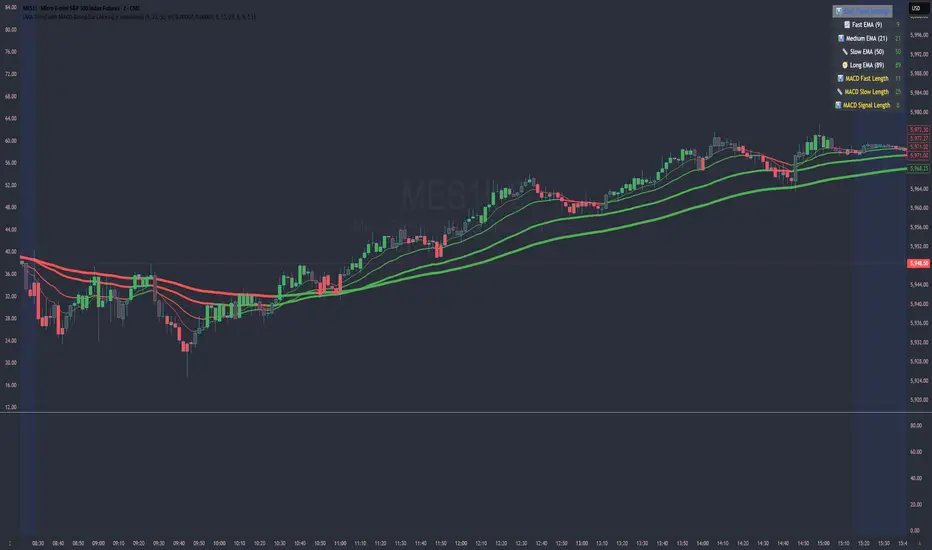
This indicator blends trend-following EMAs with MACD-based momentum signals to provide a visually intuitive view of market conditions. It's designed for traders who value clean, color-coded charts and want to quickly assess both trend direction and overbought/oversold momentum.
🔍 Key Features:
Multi-EMA Trend Visualization:
Includes four Exponential Moving Averages (EMAs):
Fast (9)
Medium (21)
Slow (50)
Long (89)
Each EMA is dynamically color-coded based on its slope—green for bullish, red for bearish, and gray for neutral—to help identify the trend strength and alignment at a glance.
MACD-Based Bar Coloring:
Candlesticks are colored based on MACD's relationship to its Bollinger Bands:
Green bars signal strong bullish momentum (MACD > Upper Band)
Red bars signal strong bearish momentum (MACD < Lower Band)
Gray bars reflect neutral conditions
Compact Visual Dashboard:
A clean, top-right table displays your current EMA and MACD settings, helping you track parameter configurations without opening the settings menu.
✅ Best Used For:
Identifying trend alignment across short- to medium-term timeframes
Filtering entries based on trend strength and MACD overextension
Enhancing discretion-based or rule-based strategies with visual confirmation
Mã nguồn mở
Theo đúng tinh thần TradingView, tác giả của tập lệnh này đã công bố nó dưới dạng mã nguồn mở, để các nhà giao dịch có thể xem xét và xác minh chức năng. Chúc mừng tác giả! Mặc dù bạn có thể sử dụng miễn phí, hãy nhớ rằng việc công bố lại mã phải tuân theo Nội quy.
Thông báo miễn trừ trách nhiệm
Thông tin và các ấn phẩm này không nhằm mục đích, và không cấu thành, lời khuyên hoặc khuyến nghị về tài chính, đầu tư, giao dịch hay các loại khác do TradingView cung cấp hoặc xác nhận. Đọc thêm tại Điều khoản Sử dụng.