OPEN-SOURCE SCRIPT
Cập nhật RSI Trigger Count (30 Days) - Both Sides
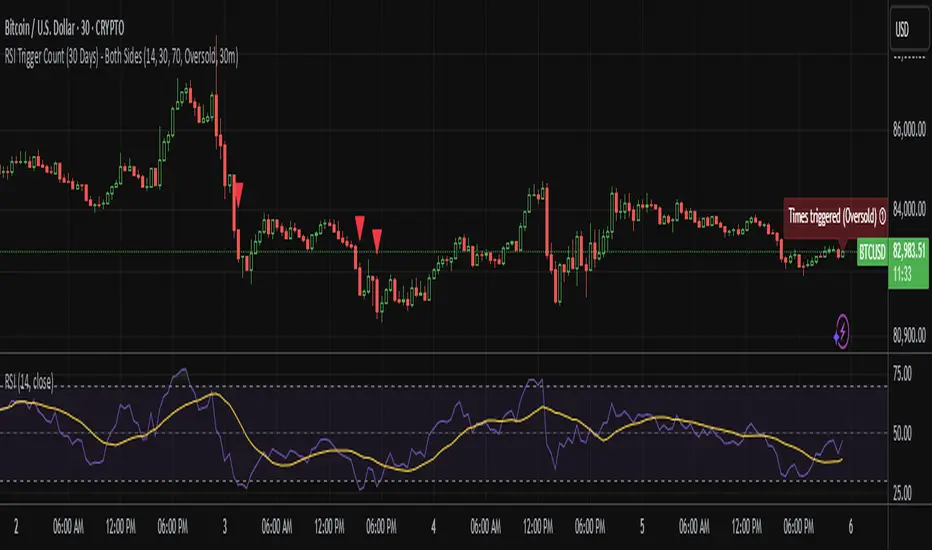
RSI Dual Trigger Counter (30 Days)
This indicator tracks both oversold (crossunder) and overbought (crossover) RSI events on a 30-minute chart, featuring:
Dual-Mode Selector:
Counts either RSI < 30 (oversold) or RSI > 70 (overbought) crossings
Toggle between modes via input menu
30-Day Rolling Count:
Displays total triggers in the last 30 days (e.g., "Times triggered (Oversold) ① 19")
Visual Alerts:
Red triangles ↓ for oversold crossunders
Green triangles ↑ for overbought crossovers
Customizable:
Adjustable RSI length (2-100) and thresholds (1-100)
Works on any timeframe (auto-scales calculations)
Purpose: Identifies frequent reversal signals for both buying dips (oversold) and selling rallies (overbought).
Phát hành các Ghi chú
Features:Tracks both oversold (RSI < 30) and overbought (RSI > 70) signals with a toggle.
30-day rolling count resets automatically.
Visual alerts (▼ red for oversold, ▲ green for overbought).
Works on all timeframes (1m to 1D+).
Use Cases:
Spot mean-reversion opportunities.
Confirm overextended price movements.
Inputs:
Adjustable RSI length, thresholds, and condition type (oversold/overbought).
Mã nguồn mở
Theo đúng tinh thần TradingView, tác giả của tập lệnh này đã công bố nó dưới dạng mã nguồn mở, để các nhà giao dịch có thể xem xét và xác minh chức năng. Chúc mừng tác giả! Mặc dù bạn có thể sử dụng miễn phí, hãy nhớ rằng việc công bố lại mã phải tuân theo Nội quy.
Thông báo miễn trừ trách nhiệm
Thông tin và các ấn phẩm này không nhằm mục đích, và không cấu thành, lời khuyên hoặc khuyến nghị về tài chính, đầu tư, giao dịch hay các loại khác do TradingView cung cấp hoặc xác nhận. Đọc thêm tại Điều khoản Sử dụng.