OPEN-SOURCE SCRIPT
Cập nhật Interquartile range
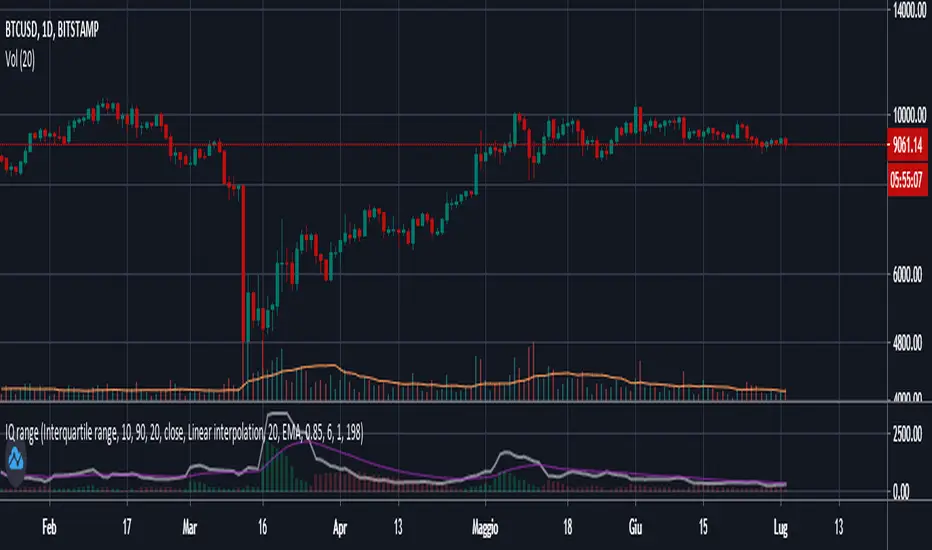
This script plots the Interquartile range (difference between 3rd and 1st quartile), providing useful infos about price distribution and volatility . It is designed to work paired with my other script "Moving percentiles channel", but you can also use it alone.
Features:
- You can compute the percentiles using Linear interpolation or Nearest Rank methods
- You can plot not only the Interquartile range, but also the range (difference between 100th and 0 percentiles) or a User defined range (you have to select which percentiles you want to use from the settings)
- The script also plots a signal line that you can use to obtain signals when the Range line crosses the signal line itself. You can plot the signal line using many different MAs ( SMA , EMA , DEMA , TEMA , WMA , VWMA , HMA , ALMA , LSMA , FRAMA ).
- It also plots an histogram that represents the difference between the Range and the Signal line. It will be green colored when positive, and red colored when negative.
Please show me your support and follow me if you like my scripts. Many more of them are coming in the future.
@ Bezzus
Phát hành các Ghi chú
Updates:- Removed unnecessary code lines.
Bezzus
Mã nguồn mở
Theo đúng tinh thần TradingView, tác giả của tập lệnh này đã công bố nó dưới dạng mã nguồn mở, để các nhà giao dịch có thể xem xét và xác minh chức năng. Chúc mừng tác giả! Mặc dù bạn có thể sử dụng miễn phí, hãy nhớ rằng việc công bố lại mã phải tuân theo Nội quy.
Thông báo miễn trừ trách nhiệm
Thông tin và các ấn phẩm này không nhằm mục đích, và không cấu thành, lời khuyên hoặc khuyến nghị về tài chính, đầu tư, giao dịch hay các loại khác do TradingView cung cấp hoặc xác nhận. Đọc thêm tại Điều khoản Sử dụng.