OPEN-SOURCE SCRIPT
RvB ( relative strength vs BTC )
Overview
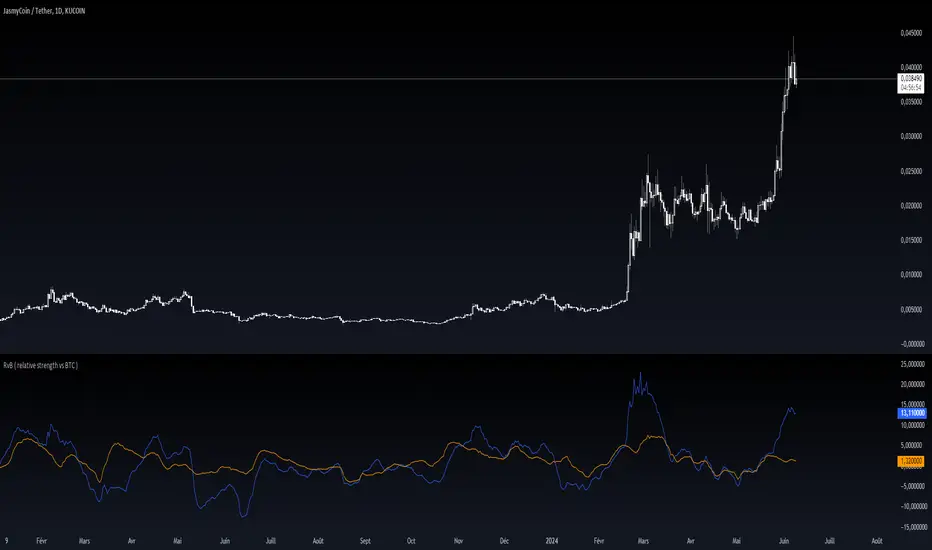
The "Coin vs BTC" indicator is designed to compare the performance of a selected cryptocurrency against Bitcoin (BTC) using Exponential Moving Averages (EMAs). By plotting the difference in EMA values as a percentage, this indicator helps traders visualize the relative strength of a cryptocurrency compared to Bitcoin over specified periods.
How It Works
EMA Calculation: The indicator calculates two EMAs (lengths specified by the user) for both the selected cryptocurrency and Bitcoin (BTC).
Length 1: Fast EMA (default: 9)
Length 2: Slow EMA (default: 21)
Score Calculation:
For both the selected coin and Bitcoin, it computes a score representing the percentage difference between the fast and slow EMAs relative to the previous closing price. This is done using the following steps:
Calculate the difference between the fast and slow EMAs.
Compute the percentage of this difference relative to the previous closing price.
Round the percentage to two decimal places for clarity.
Plotting: The scores for both the selected cryptocurrency and Bitcoin are plotted on the same chart:
Coin Score: Displayed in blue.
BTC Score: Displayed in orange.
Potential Uses
Relative Strength Analysis:
This indicator helps traders compare the strength of a cryptocurrency against Bitcoin. A higher score for the selected coin compared to Bitcoin indicates it is performing better relative to its moving averages.
Trend Confirmation:
By observing the EMA differences, traders can confirm trends and potential reversals. Consistently higher scores may indicate a strong upward trend, while lower scores could suggest a weakening trend.
Market Comparison:
This tool is particularly useful for those looking to understand how their selected cryptocurrency is performing in the broader market context, especially in relation to Bitcoin, which is often considered a market benchmark.
Mã nguồn mở
Theo đúng tinh thần TradingView, tác giả của tập lệnh này đã công bố nó dưới dạng mã nguồn mở, để các nhà giao dịch có thể xem xét và xác minh chức năng. Chúc mừng tác giả! Mặc dù bạn có thể sử dụng miễn phí, hãy nhớ rằng việc công bố lại mã phải tuân theo Nội quy.
Thông báo miễn trừ trách nhiệm
Thông tin và các ấn phẩm này không nhằm mục đích, và không cấu thành, lời khuyên hoặc khuyến nghị về tài chính, đầu tư, giao dịch hay các loại khác do TradingView cung cấp hoặc xác nhận. Đọc thêm tại Điều khoản Sử dụng.