OPEN-SOURCE SCRIPT
Fed Funds Rate-of-Change
Fed Funds Rate-of-Change
What it does:
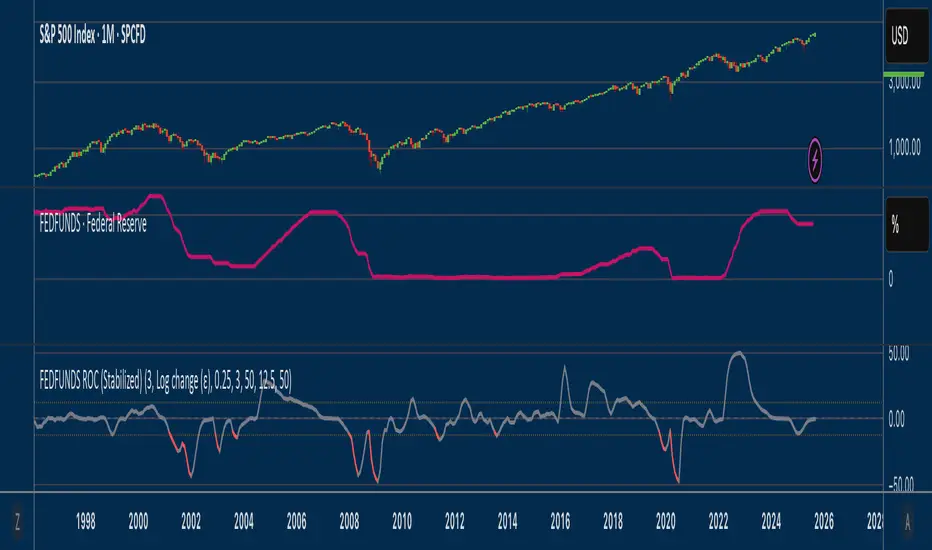
This indicator pulls the Effective Federal Funds Rate (FRED:FEDFUNDS, monthly) and measures how quickly it’s changing over a user-defined lookback. It offers stabilized change metrics that avoid the “near-zero blow-up” you see with naive % ROC. The plot turns red only when the signal is below the lower threshold and heading down (i.e., value < –threshold and slope < 0).
This indicator is meant to be useful in monitoring fast cuts on the part of the FED - a signal that has preceded recession or market pullbacks in times prior.
Change modes: Percentage, log and delta.
Percent ROC (ε floor): 100 * (now - prev) / max(prev, ε)
Log change (ε): 100 * (ln(now + ε) - ln(prev + ε))
Delta (bps): (now - prev) * 100 (basis points; avoids percentage math)
Tip: For “least drama,” use Delta (bps). For relative change without explosions near zero, use Log change (ε).
Key inputs:
Lookback (months): ROC window in calendar months (because source is monthly).
Change Metric: one of the three options above.
ε (percentage points): small constant (e.g., 0.25 pp) used by Percent ROC (ε) and Log change (ε) to stabilize near-zero values.
EMA Smoothing length: light smoothing of the computed series.
Clip |value| at: optional hard cap to tame outliers (0 = off).
Threshold % / Threshold bps: lower/upper threshold band; unit adapts to the selected metric.
Plot as histogram: optional histogram view.
Coloring / signal logic
Red: value is below the lower threshold (–threshold) and the series is falling on the current bar.
How to use:
Add to any chart (timeframe doesn’t matter; data is monthly under the hood).
Pick a Change Metric and set Lookback (e.g., 3–6 months).
Choose a reasonable threshold:
Percent/Log: try 10–20%
Delta (bps): try 50–100 bps
Optionally smooth (EMA 3–6) and/or clip extreme spikes.
Interpretation
Sustained red often marks periods of accelerating downside in the Fed Funds change metric (e.g., policy easing momentum when using bps).
Neutral (gray) provides context without implying direction bias.
Notes & limitations
Source is monthly FRED series; values update on monthly closes and are stable (no intrabar repainting of the monthly series).
Threshold units switch automatically with the metric (%, %, or bps).
Smoothing/clip are convenience tools; adjust conservatively to avoid masking important shifts.
What it does:
This indicator pulls the Effective Federal Funds Rate (FRED:FEDFUNDS, monthly) and measures how quickly it’s changing over a user-defined lookback. It offers stabilized change metrics that avoid the “near-zero blow-up” you see with naive % ROC. The plot turns red only when the signal is below the lower threshold and heading down (i.e., value < –threshold and slope < 0).
This indicator is meant to be useful in monitoring fast cuts on the part of the FED - a signal that has preceded recession or market pullbacks in times prior.
Change modes: Percentage, log and delta.
Percent ROC (ε floor): 100 * (now - prev) / max(prev, ε)
Log change (ε): 100 * (ln(now + ε) - ln(prev + ε))
Delta (bps): (now - prev) * 100 (basis points; avoids percentage math)
Tip: For “least drama,” use Delta (bps). For relative change without explosions near zero, use Log change (ε).
Key inputs:
Lookback (months): ROC window in calendar months (because source is monthly).
Change Metric: one of the three options above.
ε (percentage points): small constant (e.g., 0.25 pp) used by Percent ROC (ε) and Log change (ε) to stabilize near-zero values.
EMA Smoothing length: light smoothing of the computed series.
Clip |value| at: optional hard cap to tame outliers (0 = off).
Threshold % / Threshold bps: lower/upper threshold band; unit adapts to the selected metric.
Plot as histogram: optional histogram view.
Coloring / signal logic
Red: value is below the lower threshold (–threshold) and the series is falling on the current bar.
How to use:
Add to any chart (timeframe doesn’t matter; data is monthly under the hood).
Pick a Change Metric and set Lookback (e.g., 3–6 months).
Choose a reasonable threshold:
Percent/Log: try 10–20%
Delta (bps): try 50–100 bps
Optionally smooth (EMA 3–6) and/or clip extreme spikes.
Interpretation
Sustained red often marks periods of accelerating downside in the Fed Funds change metric (e.g., policy easing momentum when using bps).
Neutral (gray) provides context without implying direction bias.
Notes & limitations
Source is monthly FRED series; values update on monthly closes and are stable (no intrabar repainting of the monthly series).
Threshold units switch automatically with the metric (%, %, or bps).
Smoothing/clip are convenience tools; adjust conservatively to avoid masking important shifts.
Mã nguồn mở
Theo đúng tinh thần TradingView, tác giả của tập lệnh này đã công bố nó dưới dạng mã nguồn mở, để các nhà giao dịch có thể xem xét và xác minh chức năng. Chúc mừng tác giả! Mặc dù bạn có thể sử dụng miễn phí, hãy nhớ rằng việc công bố lại mã phải tuân theo Nội quy.
Thông báo miễn trừ trách nhiệm
Thông tin và các ấn phẩm này không nhằm mục đích, và không cấu thành, lời khuyên hoặc khuyến nghị về tài chính, đầu tư, giao dịch hay các loại khác do TradingView cung cấp hoặc xác nhận. Đọc thêm tại Điều khoản Sử dụng.