OPEN-SOURCE SCRIPT
Cập nhật Linear Regression Forecast
Description:
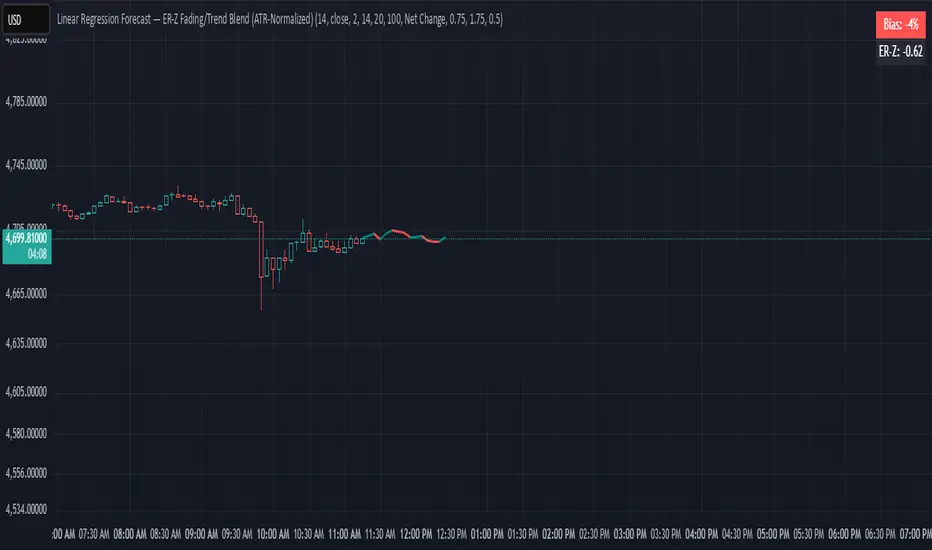
This indicator computes a series of simple linear regressions anchored at the current bar, using look-back windows from 2 bars up to the user-defined maximum. Each regression line is projected forward by the same number of bars as its look-back, producing a family of forecast endpoints. These endpoints are then connected into a continuous polyline: ascending segments are drawn in green, and descending segments in red.
Inputs:
maxLength – Maximum number of bars to include in the longest regression (minimum 2)
priceSource – Price series used for regression (for example, close, open, high, low)
lineWidth – Width of each line segment
Calculation:
For each window size N (from 2 to maxLength):
• Compute least-squares slope and intercept over the N most recent bars (with bar 0 = current bar, bar 1 = one bar ago, etc.).
• Project the regression line to bar_index + N to obtain the forecast price.
Collected forecast points are sorted by projection horizon and then joined:
• First segment: current bar’s price → first forecast point
• Subsequent segments: each forecast point → next forecast point
Segment colors reflect slope direction: green for non-negative, red for negative.
Usage:
Apply this overlay to any price chart. Adjust maxLength to control the depth and reach of the forecast fan. Observe how shorter windows produce nearer-term, more reactive projections, while longer windows yield smoother, more conservative forecasts. Use the colored segments to gauge the overall bias of the fan at each step.
Limitations:
This tool is for informational and educational purposes only. It relies on linear regression assumptions and past price behavior; it does not guarantee future performance. Users should combine it with other technical or fundamental analyses and risk management practices.
Phát hành các Ghi chú
flipPhát hành các Ghi chú
Bias displayPhát hành các Ghi chú
updatePhát hành các Ghi chú
update bias calculationPhát hành các Ghi chú
update chartPhát hành các Ghi chú
uses Efficiency Ratio instead of ADXPhát hành các Ghi chú
ER adaptive accumulationPhát hành các Ghi chú
labelPhát hành các Ghi chú
uses Z-score of Efficiency Ratio for fade - trend-following logicPhát hành các Ghi chú
colorMã nguồn mở
Theo đúng tinh thần TradingView, tác giả của tập lệnh này đã công bố nó dưới dạng mã nguồn mở, để các nhà giao dịch có thể xem xét và xác minh chức năng. Chúc mừng tác giả! Mặc dù bạn có thể sử dụng miễn phí, hãy nhớ rằng việc công bố lại mã phải tuân theo Nội quy.
Thông báo miễn trừ trách nhiệm
Thông tin và các ấn phẩm này không nhằm mục đích, và không cấu thành, lời khuyên hoặc khuyến nghị về tài chính, đầu tư, giao dịch hay các loại khác do TradingView cung cấp hoặc xác nhận. Đọc thêm tại Điều khoản Sử dụng.
Mã nguồn mở
Theo đúng tinh thần TradingView, tác giả của tập lệnh này đã công bố nó dưới dạng mã nguồn mở, để các nhà giao dịch có thể xem xét và xác minh chức năng. Chúc mừng tác giả! Mặc dù bạn có thể sử dụng miễn phí, hãy nhớ rằng việc công bố lại mã phải tuân theo Nội quy.
Thông báo miễn trừ trách nhiệm
Thông tin và các ấn phẩm này không nhằm mục đích, và không cấu thành, lời khuyên hoặc khuyến nghị về tài chính, đầu tư, giao dịch hay các loại khác do TradingView cung cấp hoặc xác nhận. Đọc thêm tại Điều khoản Sử dụng.