OPEN-SOURCE SCRIPT
Price Scenarios - The Quant Science
GENERAL OVERVIEW
Price Scenarios - The Quant Science is a quantitative statistical indicator that provides a forecast probability about future prices moving using the mathematical-statistical formula of statistical probability and expected value.
https://www.tradingview.com/x/OelfF4iR/
HOW TO USE
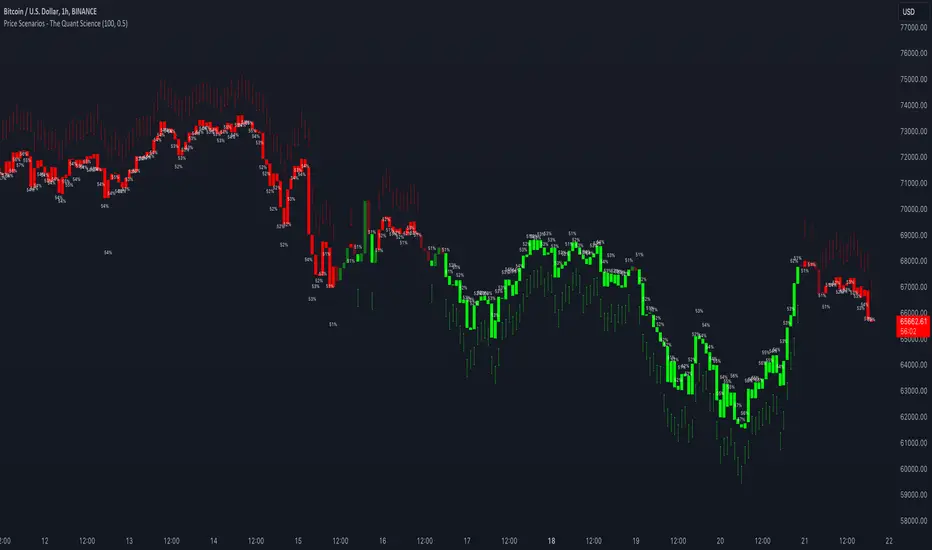
The indicator displays arrow-shaped signals that represent the probable future price movement calculated by the indicator, including the current percentage probability. Additionally, the candlesticks are colored based on the predicted direction to facilitate visual analysis. By default, green is used for bullish movements and red for bearish movements. The trader can set the analysis period (default value is 200) and the percentage threshold of probability to consider (default value is greater than 0.50 or 50%) through the user interface.
https://www.tradingview.com/x/Xw6iQecO/
USER INTERFACE
Lenght analysis: with this features you can handle the length of the dataset to be used for estimating statistical probabilities.
https://www.tradingview.com/x/PBUbP0O3/
Expected value: with this feature you can handle the threshold of the expected value to filter, only probabilities greater than this threshold will be considered by the model. By default, it is set to 0.50, which is equivalent to 50%.
https://www.tradingview.com/x/XjAUkspn/
Design Settings: modify the colors of your indicator with just a few clicks by managing this function.
https://www.tradingview.com/x/WAQySPHn/
We recommend disabling 'Wick' and 'Border' from the settings panel for a smoother and more efficient user experience.
https://www.tradingview.com/x/ZvTAJ1vC/
Price Scenarios - The Quant Science is a quantitative statistical indicator that provides a forecast probability about future prices moving using the mathematical-statistical formula of statistical probability and expected value.
https://www.tradingview.com/x/OelfF4iR/
HOW TO USE
The indicator displays arrow-shaped signals that represent the probable future price movement calculated by the indicator, including the current percentage probability. Additionally, the candlesticks are colored based on the predicted direction to facilitate visual analysis. By default, green is used for bullish movements and red for bearish movements. The trader can set the analysis period (default value is 200) and the percentage threshold of probability to consider (default value is greater than 0.50 or 50%) through the user interface.
https://www.tradingview.com/x/Xw6iQecO/
USER INTERFACE
Lenght analysis: with this features you can handle the length of the dataset to be used for estimating statistical probabilities.
https://www.tradingview.com/x/PBUbP0O3/
Expected value: with this feature you can handle the threshold of the expected value to filter, only probabilities greater than this threshold will be considered by the model. By default, it is set to 0.50, which is equivalent to 50%.
https://www.tradingview.com/x/XjAUkspn/
Design Settings: modify the colors of your indicator with just a few clicks by managing this function.
https://www.tradingview.com/x/WAQySPHn/
We recommend disabling 'Wick' and 'Border' from the settings panel for a smoother and more efficient user experience.
https://www.tradingview.com/x/ZvTAJ1vC/
Mã nguồn mở
Theo đúng tinh thần TradingView, tác giả của tập lệnh này đã công bố nó dưới dạng mã nguồn mở, để các nhà giao dịch có thể xem xét và xác minh chức năng. Chúc mừng tác giả! Mặc dù bạn có thể sử dụng miễn phí, hãy nhớ rằng việc công bố lại mã phải tuân theo Nội quy.
Thông báo miễn trừ trách nhiệm
Thông tin và các ấn phẩm này không nhằm mục đích, và không cấu thành, lời khuyên hoặc khuyến nghị về tài chính, đầu tư, giao dịch hay các loại khác do TradingView cung cấp hoặc xác nhận. Đọc thêm tại Điều khoản Sử dụng.