OPEN-SOURCE SCRIPT
Dynamic S/R Levels
# Complete Parameter Guide
## 1. Lookback Bars (Default: 500)
- **Function**: Number of historical bars the script analyzes to identify levels
- **Example**: If set to 500, the script examines the last 500 candles
- **Increase when**: Trading long-term, searching for old historical levels
- **Decrease when**: Day trading or short-term trading, viewing only recent levels
- **Recommendation**: 200-300 for day trading, 500-1000 for swing trading
## 2. Min Touches (Default: 3)
- **Function**: Minimum number of touches required for a level to be considered valid
- **Example**: If set to 3, a level with only 2 touches will not be displayed
- **Increase (4-5) when**: You want only very strong and confirmed levels
- **Decrease (2) when**: You want to identify potential levels early
- **Recommendation**: 3 is a balanced value - not too loose, not too strict
## 3. Extrema Type (Default: both)
- **Function**: Which type of extrema to identify
- **Options**:
- **min**: Support levels only (pivot lows)
- **max**: Resistance levels only (pivot highs)
- **both**: Both types
- **When to change**:
- In uptrend looking for support only: select "min"
- In downtrend looking for resistance only: select "max"
## 4. Pivot Window (Default: 5)
- **Function**: How many bars on each side are required to confirm a pivot
- **Technical explanation**: pivot low = price lower than 5 bars before it and 5 bars after it
- **Increase (7-10) when**:
- More significant extrema needed
- Less noise, fewer levels
- Good for higher timeframes
- **Decrease (3-4) when**:
- More sensitivity needed
- More levels wanted
- Good for scalping
- **Important**: Higher value = quality over quantity
## 5. Clustering Sensitivity % (Default: 0.5%)
- **Function**: Percentage deviation allowed to group touches into the same level
- **Example**: If level at $100 and sensitivity 0.5%, touches between $99.5-$100.5 count as same level
- **Increase (1-2%) when**:
- Volatile assets (crypto, small stocks)
- More consolidation of nearby levels
- Fewer levels on chart
- **Decrease (0.2-0.3%) when**:
- Stable assets (indices, forex majors)
- Higher precision needed
- Separation between close levels
- **Recommendation**: Start at 0.5% and adjust per instrument
## 6. Max Levels to Show (Default: 10)
- **Function**: Maximum number of support/resistance lines displayed on chart
- **Selection criteria**: Script prioritizes levels by:
1. Number of touches (more = stronger)
2. Price spread (tighter = more accurate)
3. Recency (most recent touch closer to present)
- **Low value (5-10)**: Clean chart with only strongest levels
- **High value (20-50)**: More options, including weaker levels
## 7. Min Bar Separation (Default: 5)
- **Function**: Minimum distance in bars between two touches of the same type (min or max)
- **Why important**: Prevents double-counting the same extremum
- **Example**: If pivot low at bar 100 and another at bar 103, only one counts
- **Increase (10-20) when**:
- Lower timeframes with much noise
- Avoiding false consolidation
- **Decrease (2-3) when**:
- Higher timeframes
- Identifying quick movements
## 8. Alert Proximity % (Default: 1%)
- **Function**: Distance from level at which to trigger alert
- **Example**: Level at $100, proximity 1% = alert between $99-$101
- **Increase (2-3%) when**:
- Earlier alerts wanted
- More preparation time needed
- May create false alerts
- **Decrease (0.5%) when**:
- More precise alerts wanted
- Stronger confirmation needed
- Less reaction time
- **Recommendation**: 1% works well for most cases
## 9. Show Price Bands (Default: true)
- **Function**: Displays zone around level instead of just a line
- **Zone size**: Plus/minus Clustering Sensitivity %
- **Why useful**:
- Levels are never exact lines
- Zone better represents reality
- Helps identify entries and exits within zone
- **Off**: Cleaner chart with only lines
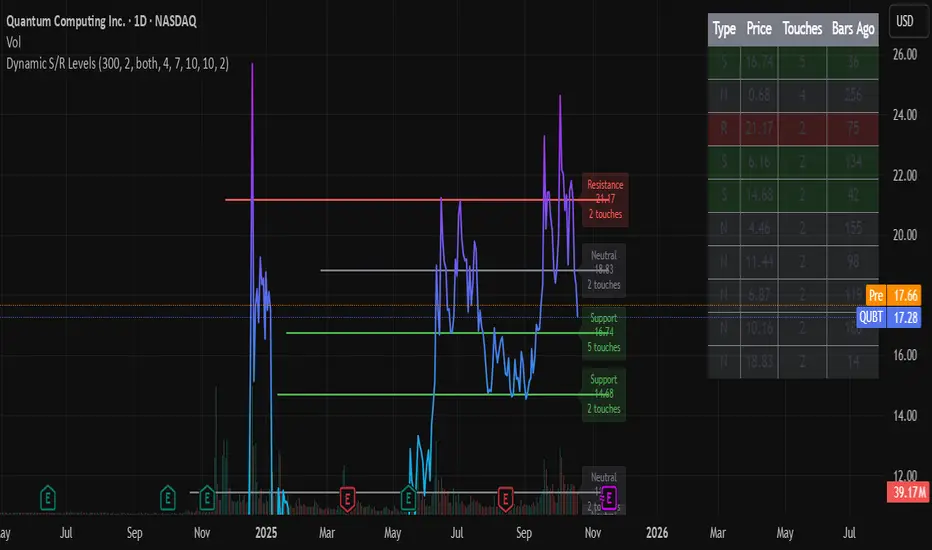
## 10. Show Info Table (Default: true)
- **Function**: Displays information table in chart corner
- **Table contents**:
- Type: S (Support) / R (Resistance) / N (Neutral)
- Price: Level price
- Touches: Number of touches
- Bars Ago: How many bars since last touch
- **Off**: If you know the levels and want a clean chart
## Recommended Settings by Trading Style:
### Day Trading (Intraday)
```
Lookback Bars: 200-300
Min Touches: 2-3
Pivot Window: 3-5
Sensitivity: 0.3-0.5%
Max Levels: 5-8
```
### Swing Trading (Days-Weeks)
```
Lookback Bars: 500-800
Min Touches: 3-4
Pivot Window: 5-7
Sensitivity: 0.5-1%
Max Levels: 10-15
```
### Position Trading (Months)
```
Lookback Bars: 1000-2000
Min Touches: 4-5
Pivot Window: 7-10
Sensitivity: 1-2%
Max Levels: 8-12
```
**Important tip**: Start with default values and adjust gradually based on the asset and results.
## 1. Lookback Bars (Default: 500)
- **Function**: Number of historical bars the script analyzes to identify levels
- **Example**: If set to 500, the script examines the last 500 candles
- **Increase when**: Trading long-term, searching for old historical levels
- **Decrease when**: Day trading or short-term trading, viewing only recent levels
- **Recommendation**: 200-300 for day trading, 500-1000 for swing trading
## 2. Min Touches (Default: 3)
- **Function**: Minimum number of touches required for a level to be considered valid
- **Example**: If set to 3, a level with only 2 touches will not be displayed
- **Increase (4-5) when**: You want only very strong and confirmed levels
- **Decrease (2) when**: You want to identify potential levels early
- **Recommendation**: 3 is a balanced value - not too loose, not too strict
## 3. Extrema Type (Default: both)
- **Function**: Which type of extrema to identify
- **Options**:
- **min**: Support levels only (pivot lows)
- **max**: Resistance levels only (pivot highs)
- **both**: Both types
- **When to change**:
- In uptrend looking for support only: select "min"
- In downtrend looking for resistance only: select "max"
## 4. Pivot Window (Default: 5)
- **Function**: How many bars on each side are required to confirm a pivot
- **Technical explanation**: pivot low = price lower than 5 bars before it and 5 bars after it
- **Increase (7-10) when**:
- More significant extrema needed
- Less noise, fewer levels
- Good for higher timeframes
- **Decrease (3-4) when**:
- More sensitivity needed
- More levels wanted
- Good for scalping
- **Important**: Higher value = quality over quantity
## 5. Clustering Sensitivity % (Default: 0.5%)
- **Function**: Percentage deviation allowed to group touches into the same level
- **Example**: If level at $100 and sensitivity 0.5%, touches between $99.5-$100.5 count as same level
- **Increase (1-2%) when**:
- Volatile assets (crypto, small stocks)
- More consolidation of nearby levels
- Fewer levels on chart
- **Decrease (0.2-0.3%) when**:
- Stable assets (indices, forex majors)
- Higher precision needed
- Separation between close levels
- **Recommendation**: Start at 0.5% and adjust per instrument
## 6. Max Levels to Show (Default: 10)
- **Function**: Maximum number of support/resistance lines displayed on chart
- **Selection criteria**: Script prioritizes levels by:
1. Number of touches (more = stronger)
2. Price spread (tighter = more accurate)
3. Recency (most recent touch closer to present)
- **Low value (5-10)**: Clean chart with only strongest levels
- **High value (20-50)**: More options, including weaker levels
## 7. Min Bar Separation (Default: 5)
- **Function**: Minimum distance in bars between two touches of the same type (min or max)
- **Why important**: Prevents double-counting the same extremum
- **Example**: If pivot low at bar 100 and another at bar 103, only one counts
- **Increase (10-20) when**:
- Lower timeframes with much noise
- Avoiding false consolidation
- **Decrease (2-3) when**:
- Higher timeframes
- Identifying quick movements
## 8. Alert Proximity % (Default: 1%)
- **Function**: Distance from level at which to trigger alert
- **Example**: Level at $100, proximity 1% = alert between $99-$101
- **Increase (2-3%) when**:
- Earlier alerts wanted
- More preparation time needed
- May create false alerts
- **Decrease (0.5%) when**:
- More precise alerts wanted
- Stronger confirmation needed
- Less reaction time
- **Recommendation**: 1% works well for most cases
## 9. Show Price Bands (Default: true)
- **Function**: Displays zone around level instead of just a line
- **Zone size**: Plus/minus Clustering Sensitivity %
- **Why useful**:
- Levels are never exact lines
- Zone better represents reality
- Helps identify entries and exits within zone
- **Off**: Cleaner chart with only lines
## 10. Show Info Table (Default: true)
- **Function**: Displays information table in chart corner
- **Table contents**:
- Type: S (Support) / R (Resistance) / N (Neutral)
- Price: Level price
- Touches: Number of touches
- Bars Ago: How many bars since last touch
- **Off**: If you know the levels and want a clean chart
## Recommended Settings by Trading Style:
### Day Trading (Intraday)
```
Lookback Bars: 200-300
Min Touches: 2-3
Pivot Window: 3-5
Sensitivity: 0.3-0.5%
Max Levels: 5-8
```
### Swing Trading (Days-Weeks)
```
Lookback Bars: 500-800
Min Touches: 3-4
Pivot Window: 5-7
Sensitivity: 0.5-1%
Max Levels: 10-15
```
### Position Trading (Months)
```
Lookback Bars: 1000-2000
Min Touches: 4-5
Pivot Window: 7-10
Sensitivity: 1-2%
Max Levels: 8-12
```
**Important tip**: Start with default values and adjust gradually based on the asset and results.
Mã nguồn mở
Theo đúng tinh thần TradingView, người tạo ra tập lệnh này đã biến tập lệnh thành mã nguồn mở để các nhà giao dịch có thể xem xét và xác minh công năng. Xin dành lời khen tặng cho tác giả! Mặc dù bạn có thể sử dụng miễn phí, nhưng lưu ý nếu đăng lại mã, bạn phải tuân theo Quy tắc nội bộ của chúng tôi.
Thông báo miễn trừ trách nhiệm
Thông tin và ấn phẩm không có nghĩa là và không cấu thành, tài chính, đầu tư, kinh doanh, hoặc các loại lời khuyên hoặc khuyến nghị khác được cung cấp hoặc xác nhận bởi TradingView. Đọc thêm trong Điều khoản sử dụng.