OPEN-SOURCE SCRIPT
MA Cross Heatmap
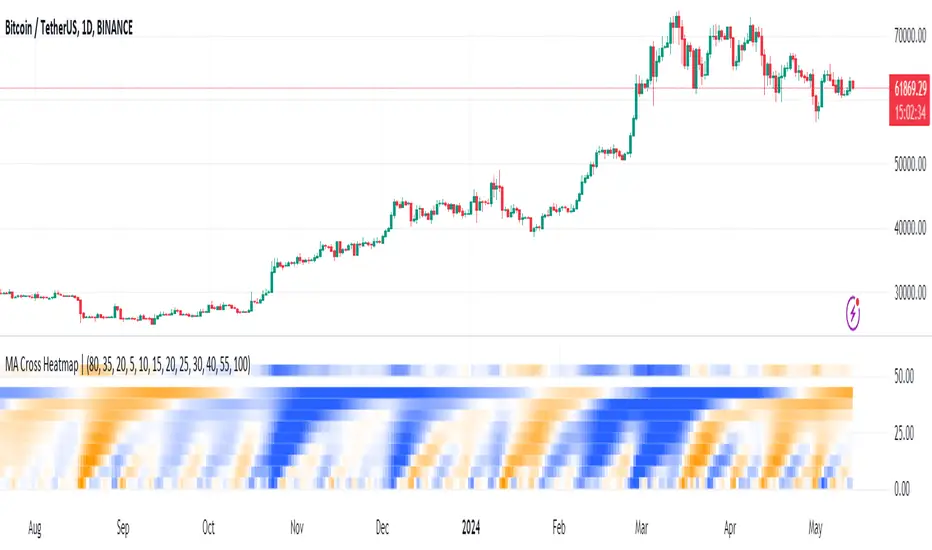
The Moving Average Cross Heatmap Created by Technicator, visualizes the crossing distances between multiple moving averages using a heat map style color coding.
The main purpose of this visualization is to help identify potential trend changes or trading opportunities by looking at where the moving averages cross over each other.
Key Features:
This is a unique way to combine multiple MA analysis with a visual heat map representation on one indicator. The code allows you to fine-tune the parameters to suit your trading style and preferences. Worth checking out if you trade using multiple moving average crossovers as part of your strategy.
The main purpose of this visualization is to help identify potential trend changes or trading opportunities by looking at where the moving averages cross over each other.
Key Features:
- Can plot up to 9 different moving average with their cross lengths you set
- Uses a heat map to show crossing distances between the MAs
- Adjustable settings like crossing length percentage, color scheme, color ceiling etc.
- Overlay style separates the heat map from the price chart
This is a unique way to combine multiple MA analysis with a visual heat map representation on one indicator. The code allows you to fine-tune the parameters to suit your trading style and preferences. Worth checking out if you trade using multiple moving average crossovers as part of your strategy.
Mã nguồn mở
Theo đúng tinh thần TradingView, tác giả của tập lệnh này đã công bố nó dưới dạng mã nguồn mở, để các nhà giao dịch có thể xem xét và xác minh chức năng. Chúc mừng tác giả! Mặc dù bạn có thể sử dụng miễn phí, hãy nhớ rằng việc công bố lại mã phải tuân theo Nội quy.
Thông báo miễn trừ trách nhiệm
Thông tin và các ấn phẩm này không nhằm mục đích, và không cấu thành, lời khuyên hoặc khuyến nghị về tài chính, đầu tư, giao dịch hay các loại khác do TradingView cung cấp hoặc xác nhận. Đọc thêm tại Điều khoản Sử dụng.