OPEN-SOURCE SCRIPT
Cập nhật Historic High Lows Adaptive
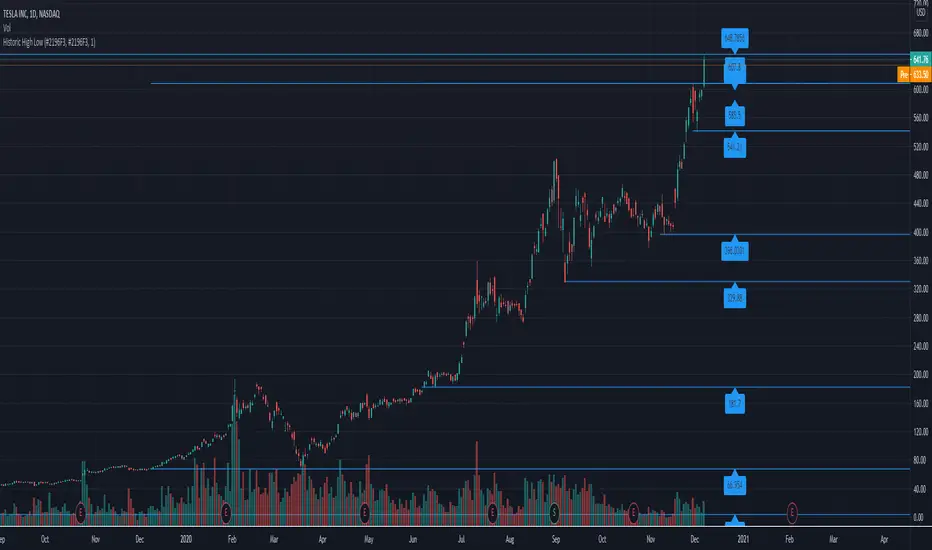
This will plot in the ticker opened:
-All-time High and Low
-1 Year High and Low
-6 Months High and Low
-3 Months High and Low
-1 Month High and Low
-1 Week High and Low
-Previous day High and Low
Colors, extending the line to the right, width, showing price tag are all parameters.
High and Low calculations are updated daily
Lines haves issues sometimes rendering when the candles are in a period too small.
Phát hành các Ghi chú
Updated Script to fix issue where lines would be redrawn if a high or low are made on intraday. It should now only look at the past dates and prevent the line from redrawing till the next day.Mã nguồn mở
Theo đúng tinh thần TradingView, tác giả của tập lệnh này đã công bố nó dưới dạng mã nguồn mở, để các nhà giao dịch có thể xem xét và xác minh chức năng. Chúc mừng tác giả! Mặc dù bạn có thể sử dụng miễn phí, hãy nhớ rằng việc công bố lại mã phải tuân theo Nội quy.
Thông báo miễn trừ trách nhiệm
Thông tin và các ấn phẩm này không nhằm mục đích, và không cấu thành, lời khuyên hoặc khuyến nghị về tài chính, đầu tư, giao dịch hay các loại khác do TradingView cung cấp hoặc xác nhận. Đọc thêm tại Điều khoản Sử dụng.
Mã nguồn mở
Theo đúng tinh thần TradingView, tác giả của tập lệnh này đã công bố nó dưới dạng mã nguồn mở, để các nhà giao dịch có thể xem xét và xác minh chức năng. Chúc mừng tác giả! Mặc dù bạn có thể sử dụng miễn phí, hãy nhớ rằng việc công bố lại mã phải tuân theo Nội quy.
Thông báo miễn trừ trách nhiệm
Thông tin và các ấn phẩm này không nhằm mục đích, và không cấu thành, lời khuyên hoặc khuyến nghị về tài chính, đầu tư, giao dịch hay các loại khác do TradingView cung cấp hoặc xác nhận. Đọc thêm tại Điều khoản Sử dụng.