OPEN-SOURCE SCRIPT
SMA with ATR Bands
SMA with ATR Bands
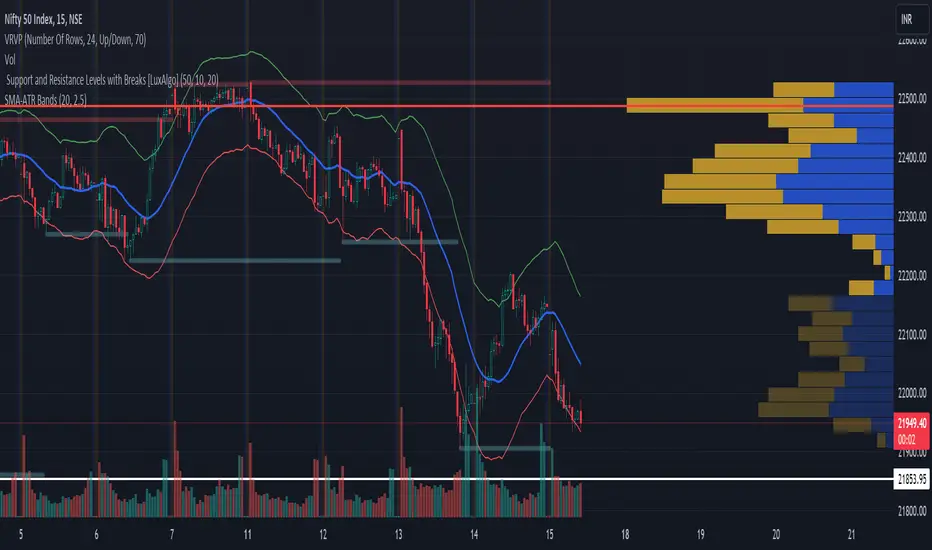
This custom indicator combines the Simple Moving Average (SMA) with Average True Range (ATR) bands. It’s designed to help traders identify potential price reversals and gauge volatility. Here’s what it does:
Simple Moving Average (SMA):
The SMA represents the average price over a specified period.
It acts as a trend-following line, smoothing out price fluctuations.
The blue line on the chart represents the SMA.
ATR Bands:
The ATR measures volatility by calculating the average range between high and low prices.
We add and subtract the ATR (multiplied by a user-defined factor) from the SMA to create the bands.
The green upper band and red lower band dynamically adjust based on volatility.
How to Use It:
Volatility Signals: When the bands are close together (a “squeeze”), it indicates low volatility. A breakout often follows.
Overbought/Oversold: Price touching the upper band suggests overbought conditions, while touching the lower band suggests oversold conditions.
Trend Confirmation: The indicator can confirm trends.
Feel free to use this indicator on TradingView to enhance your trading strategy. Remember to customize the parameters according to your preferences. Happy trading! 📈🚀
Mã nguồn mở
Theo đúng tinh thần TradingView, tác giả của tập lệnh này đã công bố nó dưới dạng mã nguồn mở, để các nhà giao dịch có thể xem xét và xác minh chức năng. Chúc mừng tác giả! Mặc dù bạn có thể sử dụng miễn phí, hãy nhớ rằng việc công bố lại mã phải tuân theo Nội quy.
Thông báo miễn trừ trách nhiệm
Thông tin và các ấn phẩm này không nhằm mục đích, và không cấu thành, lời khuyên hoặc khuyến nghị về tài chính, đầu tư, giao dịch hay các loại khác do TradingView cung cấp hoặc xác nhận. Đọc thêm tại Điều khoản Sử dụng.