OPEN-SOURCE SCRIPT
Amplitude [Anan]
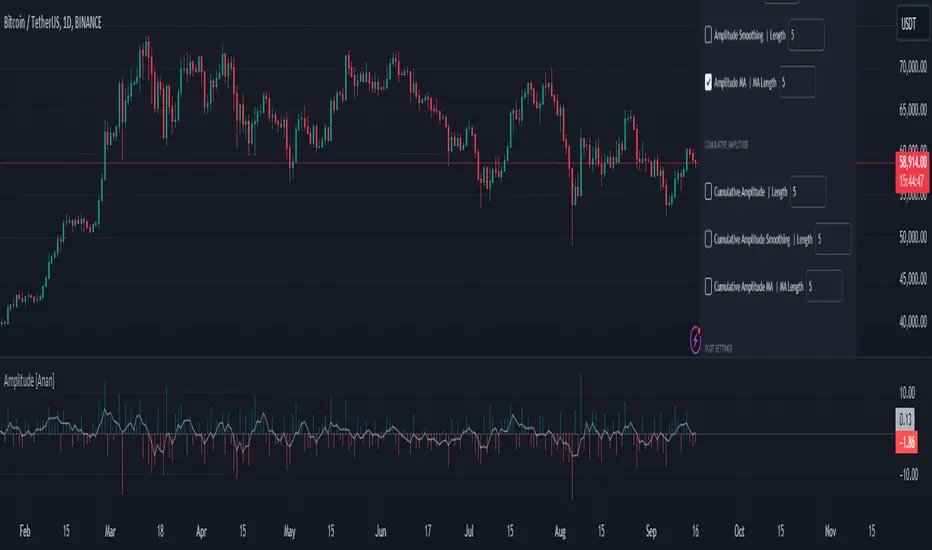
The Amplitude [Anan] indicator calculates and visualizes both the amplitude and cumulative amplitude of price movements, providing traders with insights into price volatility and trend strength. By distinguishing between positive and negative amplitude movements, this indicator aids in identifying bullish and bearish sentiments, potential reversal points, and confirming trend directions.
█ Main Formulas
‣ Amplitude = High - Low
‣ Cumulative Amplitude = sum of Amplitude over the specified lookback period
‣ Percentage Amplitude = (Amplitude / Open) × 100%
█ Key Features
✦Dual Amplitude Calculations:
Amplitude: Reflects price range and direction over a short-term period.
Cumulative Amplitude: Aggregates amplitude over a longer period for broader trend analysis.
✦Customizable Parameters: Adjust lookback periods, smoothing options, moving averages and Alerts.
✦Direction Separation: Distinguish between positive and negative amplitude movements to identify market sentiment.
✦Flexible Visualization: Customizable colors and plot styles for enhanced chart readability.
✦Alert System: Generate signals based on amplitude direction and moving average crossovers
█ How to Use and Interpret
✦Understanding Amplitude and Cumulative Amplitude:
‣Amplitude: Measures the price range (high - low) over a specified short-term period.
‣Cumulative Amplitude: Aggregates amplitude over a defined longer-term period.
‣Percentage Representation: shows amplitude relative to the open price from `amp_length` bars ago, providing a normalized view.
‣Interpretation:
Large Amplitude Values: Indicate high volatility.
Small Amplitude Values: Indicate low volatility.
✦Trend Identification:
‣Uptrend: Consistently positive amplitudes and upward-moving averages.
‣Downtrend: Consistently negative amplitudes and downward-moving averages.
✦Overbought/Oversold Conditions:
‣High Positive Amplitude: May indicate overbought conditions and potential reversals.
‣High Negative Amplitude: May indicate oversold conditions and potential reversals.
✦Volatility Analysis:
‣High Amplitude Values: Suggest increased market volatility.
‣Low Amplitude Values: Suggest reduced market volatility.
✦Signal Confirmation:
‣Moving Average Crossovers: Confirm the strength and direction of trends, aiding in informed trading decisions.
✦Trading Strategies:
‣ Breakout Trading: Large increases in amplitude can signal potential breakouts.
‣ Mean Reversion: Extreme amplitude values may indicate upcoming price corrections.
‣ Volatility-Based Strategies: Adjust position sizes or trading frequency based on amplitude magnitudes.
‣ Multi-Timeframe Analysis: Compare amplitudes across different timeframes for a comprehensive market view.
█ Customization Tips
‣ Lookback Periods: Experiment with different periods to suit your trading style and asset characteristics.
‣ Smoothing Settings: Adjust to balance responsiveness and noise reduction.
‣ Percentage Amplitude: Use for normalized comparisons across different price levels.
█ Main Formulas
‣ Amplitude = High - Low
‣ Cumulative Amplitude = sum of Amplitude over the specified lookback period
‣ Percentage Amplitude = (Amplitude / Open) × 100%
- High: Candle high (or highest high when lookback > 1)
- Low: Candle low (or lowest low when lookback > 1)
- Open: Open price of the first candle in the lookback period
█ Key Features
✦Dual Amplitude Calculations:
Amplitude: Reflects price range and direction over a short-term period.
Cumulative Amplitude: Aggregates amplitude over a longer period for broader trend analysis.
✦Customizable Parameters: Adjust lookback periods, smoothing options, moving averages and Alerts.
✦Direction Separation: Distinguish between positive and negative amplitude movements to identify market sentiment.
✦Flexible Visualization: Customizable colors and plot styles for enhanced chart readability.
✦Alert System: Generate signals based on amplitude direction and moving average crossovers
█ How to Use and Interpret
✦Understanding Amplitude and Cumulative Amplitude:
‣Amplitude: Measures the price range (high - low) over a specified short-term period.
‣Cumulative Amplitude: Aggregates amplitude over a defined longer-term period.
‣Percentage Representation: shows amplitude relative to the open price from `amp_length` bars ago, providing a normalized view.
‣Interpretation:
Large Amplitude Values: Indicate high volatility.
Small Amplitude Values: Indicate low volatility.
✦Trend Identification:
‣Uptrend: Consistently positive amplitudes and upward-moving averages.
‣Downtrend: Consistently negative amplitudes and downward-moving averages.
✦Overbought/Oversold Conditions:
‣High Positive Amplitude: May indicate overbought conditions and potential reversals.
‣High Negative Amplitude: May indicate oversold conditions and potential reversals.
✦Volatility Analysis:
‣High Amplitude Values: Suggest increased market volatility.
‣Low Amplitude Values: Suggest reduced market volatility.
✦Signal Confirmation:
‣Moving Average Crossovers: Confirm the strength and direction of trends, aiding in informed trading decisions.
✦Trading Strategies:
‣ Breakout Trading: Large increases in amplitude can signal potential breakouts.
‣ Mean Reversion: Extreme amplitude values may indicate upcoming price corrections.
‣ Volatility-Based Strategies: Adjust position sizes or trading frequency based on amplitude magnitudes.
‣ Multi-Timeframe Analysis: Compare amplitudes across different timeframes for a comprehensive market view.
█ Customization Tips
‣ Lookback Periods: Experiment with different periods to suit your trading style and asset characteristics.
‣ Smoothing Settings: Adjust to balance responsiveness and noise reduction.
‣ Percentage Amplitude: Use for normalized comparisons across different price levels.
Mã nguồn mở
Theo đúng tinh thần TradingView, tác giả của tập lệnh này đã công bố nó dưới dạng mã nguồn mở, để các nhà giao dịch có thể xem xét và xác minh chức năng. Chúc mừng tác giả! Mặc dù bạn có thể sử dụng miễn phí, hãy nhớ rằng việc công bố lại mã phải tuân theo Nội Quy.
Thông báo miễn trừ trách nhiệm
Thông tin và các ấn phẩm này không nhằm mục đích, và không cấu thành, lời khuyên hoặc khuyến nghị về tài chính, đầu tư, giao dịch hay các loại khác do TradingView cung cấp hoặc xác nhận. Đọc thêm tại Điều khoản Sử dụng.