OPEN-SOURCE SCRIPT
ATR Based EMA Price Targets [SS]
As requested...
This is a spinoff of my EMA 9/21 cross indicator with price targets.
A few of you asked for a simple EMA crossover version and that is what this is.
I have, of course, added a bit of extra functionality to it, assuming you would want to transition from another EMA indicator to this one, I tried to leave it somewhat customizable so you can get the same type of functionality as any other EMA based indicator just with the added advantage of having an ATR based assessment added on. So lets get into the details:
What it does:
Same as my EMA 9/21, simply performs a basic ATR range analysis on a ticker, calculating the average move it does on a bullish or bearish cross.
How to use it:
So there are quite a few functions of this indicator. I am going to break them down one by one, from most basic to the more complex.
Plot functions:
EMA is Customizable: The EMA is customizable. If you want the 200, 100, 50, 31, 9, whatever you want, you just have to add the desired EMA timeframe in the settings menu.
Standard Deviation Bands are an option: If you like to have standard deviation bands added to your EMA's, you can select to show the standard deviation band. It will plot the standard deviation for the desired EMA timeframe (so if it is the EMA 200, it will plot the Standard Deviation on the EMA 200).
Plotting Crossovers: You can have the indicator plot green arrows for bullish crosses and red arrows for bearish crosses. I have smoothed out this function slightly by only having it signal a crossover when it breaks and holds. I pulled this over to the alert condition functions as well, so you are not constantly being alerted when it is bouncing over and below an EMA. Only once it chooses a direction, holds and moves up or down, will it alert to a true crossover.
Plotting labels: The indicator will default to plotting the price target labels and the EMA label. You can toggle these on and off in the EMA settings menu.
Trend Assessment Settings:
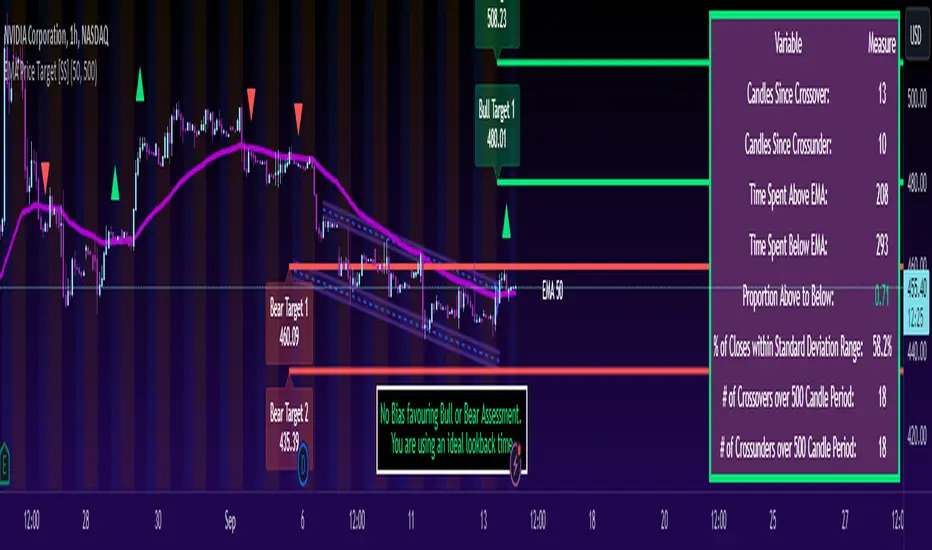
In addition to plotting the EMA itself and signaling the ATR ranges, the EMA will provide you will demographic information about the trend and price action behaviour around the EMA. You can see an example in the image below:

This will provide you with a breakdown of the statistics on the EMA over the designated lookback period, such as the number of crosses, the time above and below the EMA and the amount the EMA has remained within its standard deviation bands.
Where this is important is the proportion assessment. And what the proportion assessment is doing is its measuring the amount of time the ticker is spending either above or below the EMA.
Ideally, you should have relatively equal and uniform durations above and below. This would be a proportion of between 0.5 and 1.5 Above to Below. Now, you don't have to remember this because you can ask the indicator to do the assessment for you. It will be displayed at the bottom of your chart in a table that you can toggle on and off:
Example of a Uniform Assessment:

Example of a biased assessment:

Keep in mind, if you are using those very laggy EMAs (like the 50, 200, 100 etc.) on the daily timeframe, you aren't going to get uniformity in the data. This is because, stocks are technically already biased to the upside over time. Thus, when you are looking at the big picture, the bull bias thesis of the stock market is in play.
But for the smaller and moderate timeframes, owning to the randomness of price action, you can generally get uniformity in data representation by simply adjusting your lookback period.
To adjust your lookback period, you simply need to change the timeframe for the ATR lookback length. I suggest no less than 500 and probably no more than 1,500 candles, and work within this range. But you can use what the indicator indicates is appropriate.
Of course, all of these charts can be turned off and you are left with a clean looking EMA indicator:

And an example with the standard deviation bands toggled on:

And that, my friends, is the indicator.
Hopefully this is what you wanted, let me know if you have any suggestions.
Enjoy and safe trades!
This is a spinoff of my EMA 9/21 cross indicator with price targets.
A few of you asked for a simple EMA crossover version and that is what this is.
I have, of course, added a bit of extra functionality to it, assuming you would want to transition from another EMA indicator to this one, I tried to leave it somewhat customizable so you can get the same type of functionality as any other EMA based indicator just with the added advantage of having an ATR based assessment added on. So lets get into the details:
What it does:
Same as my EMA 9/21, simply performs a basic ATR range analysis on a ticker, calculating the average move it does on a bullish or bearish cross.
How to use it:
So there are quite a few functions of this indicator. I am going to break them down one by one, from most basic to the more complex.
Plot functions:
EMA is Customizable: The EMA is customizable. If you want the 200, 100, 50, 31, 9, whatever you want, you just have to add the desired EMA timeframe in the settings menu.
Standard Deviation Bands are an option: If you like to have standard deviation bands added to your EMA's, you can select to show the standard deviation band. It will plot the standard deviation for the desired EMA timeframe (so if it is the EMA 200, it will plot the Standard Deviation on the EMA 200).
Plotting Crossovers: You can have the indicator plot green arrows for bullish crosses and red arrows for bearish crosses. I have smoothed out this function slightly by only having it signal a crossover when it breaks and holds. I pulled this over to the alert condition functions as well, so you are not constantly being alerted when it is bouncing over and below an EMA. Only once it chooses a direction, holds and moves up or down, will it alert to a true crossover.
Plotting labels: The indicator will default to plotting the price target labels and the EMA label. You can toggle these on and off in the EMA settings menu.
Trend Assessment Settings:
In addition to plotting the EMA itself and signaling the ATR ranges, the EMA will provide you will demographic information about the trend and price action behaviour around the EMA. You can see an example in the image below:
This will provide you with a breakdown of the statistics on the EMA over the designated lookback period, such as the number of crosses, the time above and below the EMA and the amount the EMA has remained within its standard deviation bands.
Where this is important is the proportion assessment. And what the proportion assessment is doing is its measuring the amount of time the ticker is spending either above or below the EMA.
Ideally, you should have relatively equal and uniform durations above and below. This would be a proportion of between 0.5 and 1.5 Above to Below. Now, you don't have to remember this because you can ask the indicator to do the assessment for you. It will be displayed at the bottom of your chart in a table that you can toggle on and off:
Example of a Uniform Assessment:
Example of a biased assessment:
Keep in mind, if you are using those very laggy EMAs (like the 50, 200, 100 etc.) on the daily timeframe, you aren't going to get uniformity in the data. This is because, stocks are technically already biased to the upside over time. Thus, when you are looking at the big picture, the bull bias thesis of the stock market is in play.
But for the smaller and moderate timeframes, owning to the randomness of price action, you can generally get uniformity in data representation by simply adjusting your lookback period.
To adjust your lookback period, you simply need to change the timeframe for the ATR lookback length. I suggest no less than 500 and probably no more than 1,500 candles, and work within this range. But you can use what the indicator indicates is appropriate.
Of course, all of these charts can be turned off and you are left with a clean looking EMA indicator:
And an example with the standard deviation bands toggled on:
And that, my friends, is the indicator.
Hopefully this is what you wanted, let me know if you have any suggestions.
Enjoy and safe trades!
Mã nguồn mở
Theo đúng tinh thần TradingView, tác giả của tập lệnh này đã công bố nó dưới dạng mã nguồn mở, để các nhà giao dịch có thể xem xét và xác minh chức năng. Chúc mừng tác giả! Mặc dù bạn có thể sử dụng miễn phí, hãy nhớ rằng việc công bố lại mã phải tuân theo Nội quy.
Get:
- Live Updates,
- Discord access,
- Access to my Proprietary Merlin Software,
- Access to premium indicators,
patreon.com/steversteves
Now on X!
- Live Updates,
- Discord access,
- Access to my Proprietary Merlin Software,
- Access to premium indicators,
patreon.com/steversteves
Now on X!
Thông báo miễn trừ trách nhiệm
Thông tin và các ấn phẩm này không nhằm mục đích, và không cấu thành, lời khuyên hoặc khuyến nghị về tài chính, đầu tư, giao dịch hay các loại khác do TradingView cung cấp hoặc xác nhận. Đọc thêm tại Điều khoản Sử dụng.