OPEN-SOURCE SCRIPT
Cập nhật ASG Delta %
This utility script provides a convenient way to calculate the percentage gain or drop of a token's price within a user-defined date range. It eliminates the need for manual measurement on individual charts, saving time and effort.
The script is particularly valuable when integrated into a daily token scanning routine for watchlists. By comparing the significant gains or drops among different tokens, traders can identify potential trading opportunities.
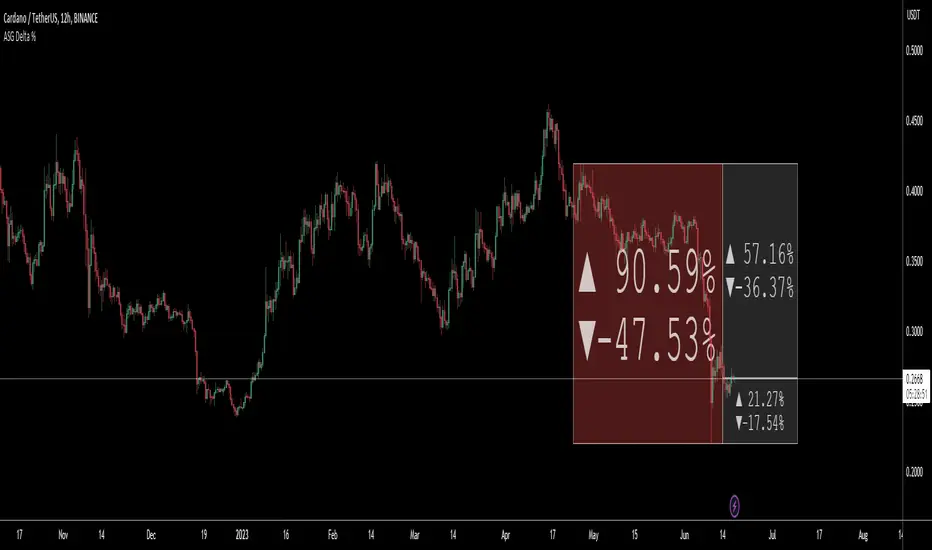
Simply select the desired date range, and the script will identify the highest and lowest price points achieved during that period. It then shows a visual representation in the form of a bullish or bearish box, displaying the percentage change (delta %). If the current price falls within the box's upper and lower bounds, additional percentage information can be shown in either the 'normal' or 'reverse' mode.
For instance, if a token experiences a -52.35% drop, enabling the 'Reverse' setting will reveal a potential 109.86% gain (from the low), or a 76.02% gain (from current price) or a potential drop of -16.5% (from current price) etc.. Having these basic statistics available, without having to manually chart them, especially during prolonged bear or bull markets, enables traders to make informed decisions and position themselves for more profitable trades.
I hope you find this script valuable. Your comments and recommendations are welcome as they will help improve the script's functionality further.


The script is particularly valuable when integrated into a daily token scanning routine for watchlists. By comparing the significant gains or drops among different tokens, traders can identify potential trading opportunities.
Simply select the desired date range, and the script will identify the highest and lowest price points achieved during that period. It then shows a visual representation in the form of a bullish or bearish box, displaying the percentage change (delta %). If the current price falls within the box's upper and lower bounds, additional percentage information can be shown in either the 'normal' or 'reverse' mode.
For instance, if a token experiences a -52.35% drop, enabling the 'Reverse' setting will reveal a potential 109.86% gain (from the low), or a 76.02% gain (from current price) or a potential drop of -16.5% (from current price) etc.. Having these basic statistics available, without having to manually chart them, especially during prolonged bear or bull markets, enables traders to make informed decisions and position themselves for more profitable trades.
I hope you find this script valuable. Your comments and recommendations are welcome as they will help improve the script's functionality further.
Phát hành các Ghi chú
1. Made some modifications to display both 'normal' and 'reverse' percentage changes at the same time2. Added some 'style' changes like "[BOX]" to display the extra deltas within a Box background - this allows the internal text to auto-resize
3. Some minor mods to allow you to display "arrows" or "%" signs if desired
4. Streamlined code
Mã nguồn mở
Theo đúng tinh thần TradingView, tác giả của tập lệnh này đã công bố nó dưới dạng mã nguồn mở, để các nhà giao dịch có thể xem xét và xác minh chức năng. Chúc mừng tác giả! Mặc dù bạn có thể sử dụng miễn phí, hãy nhớ rằng việc công bố lại mã phải tuân theo Nội quy.
Thông báo miễn trừ trách nhiệm
Thông tin và các ấn phẩm này không nhằm mục đích, và không cấu thành, lời khuyên hoặc khuyến nghị về tài chính, đầu tư, giao dịch hay các loại khác do TradingView cung cấp hoặc xác nhận. Đọc thêm tại Điều khoản Sử dụng.