OPEN-SOURCE SCRIPT
Perfect Trend EMAs (9-21-50-100)
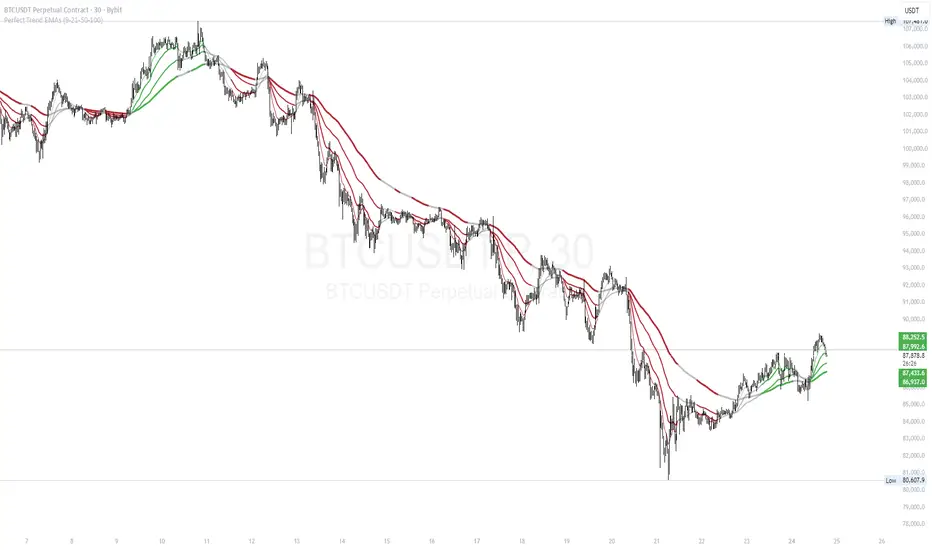
This indicator provides a clear, color-coded visual representation of trend strength based on the alignment of four Exponential Moving Averages (EMAs). It is designed to help traders identify "Perfect Trend" setups, where momentum is fully aligned across multiple timeframes, and filter out choppy or ranging markets.
How it Works (The Logic) The indicator plots four distinct EMAs (default lengths: 9, 21, 50, and 100). Instead of simply looking for crossovers, this script analyzes the hierarchical stacking of these averages to determine the market state.
The color coding follows these specific rules:
🟢 Bullish Alignment (Green): This occurs only when there is a "Perfect Bullish" stack.
Logic: EMA 9 > EMA 21 > EMA 50 > EMA 100
Interpretation: Short-term momentum is stronger than long-term momentum, indicating a strong uptrend.
🔴 Bearish Alignment (Red): This occurs only when there is a "Perfect Bearish" stack.
Logic: EMA 9 < EMA 21 < EMA 50 < EMA 100
Interpretation: Short-term momentum is weaker than long-term momentum, indicating a strong downtrend.
⚪ Consolidation / Transition (Gray):
Logic: Any other combination.
Interpretation: The moving averages are intertwined or not perfectly aligned. This usually signals a ranging market, a consolidation phase, or the early stages of a trend reversal before the alignment is confirmed.
Features
Dynamic Coloring: All EMA lines change color simultaneously to provide an instant visual signal of the market state.
Visual Fill: A soft background fill is applied between the fastest (9) and slowest (100) EMA to create a "Trend Cloud," making it easier to spot the expansion and contraction of the trend.
Customization: Users can adjust the lengths of all four EMAs in the settings menu to fit different trading styles (e.g., changing to 20/50/100/200).
How to Use
Trend Following: Traders can look for the lines to turn Green or Red to confirm a trend entry.
Filtering Noise: The Gray zones serve as a filter. If the lines are Gray, the trend is not fully established, suggesting caution or a "wait and see" approach.
Exits: A change from Green/Red back to Gray can act as an early warning sign that the trend momentum is fading.
Mã nguồn mở
Theo đúng tinh thần TradingView, tác giả của tập lệnh này đã công bố nó dưới dạng mã nguồn mở, để các nhà giao dịch có thể xem xét và xác minh chức năng. Chúc mừng tác giả! Mặc dù bạn có thể sử dụng miễn phí, hãy nhớ rằng việc công bố lại mã phải tuân theo Nội quy.
Thông báo miễn trừ trách nhiệm
Thông tin và các ấn phẩm này không nhằm mục đích, và không cấu thành, lời khuyên hoặc khuyến nghị về tài chính, đầu tư, giao dịch hay các loại khác do TradingView cung cấp hoặc xác nhận. Đọc thêm tại Điều khoản Sử dụng.