OPEN-SOURCE SCRIPT
Cập nhật Smooth RSI [MarktQuant]
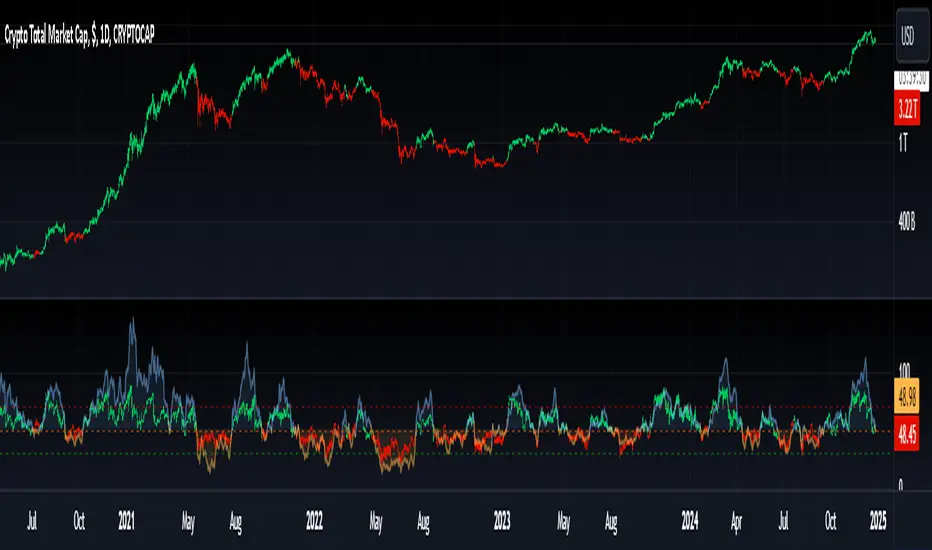
This indicator combines elements of the Relative Strength Index (RSI) and Rate of Change (RoC) to provide a smoother and potentially more insightful view of market momentum and price movement. The Smooth RSI [MarktQuant] calculates RSI values across four price points (high, open, low, close) to average them, offering a less volatile RSI signal. Additionally, it incorporates a Rate of Change for trend confirmation, enhancing the decision-making process for trade entries and exits.
Features:
Visual Signals:

Customizable Display:
Inputs:
Usage:
Long signals are indicated when the average RSI is above 50 and the RoC is positive.
Short signals are suggested when the average RSI falls below 50 with a negative RoC.
The color coding helps visually confirm trends at a glance.
Notes:
This indicator is best used in conjunction with other analysis methods to confirm signals.
Adjust the length parameters based on your trading timeframe for optimal results.
Disclaimer:
This indicator does not guarantee trading success; use it as part of a comprehensive trading strategy. Always conduct your own analysis before making trading decisions.
Features:
- Multi-RSI Calculation: RSI is computed for high, open, low, and close prices, then averaged to reduce noise.
- Trend Confirmation with RoC: Uses the Rate of Change to validate the RSI signals, coloring bars based on the trend direction.
Visual Signals:
- Bar colors change based on combined RSI and RoC signals.
- Green for bullish signals (RSI above 50 and positive RoC).
- Red for bearish signals (RSI below 50 and negative RoC).
- Horizontal lines at 30, 50, and 70 to denote overbought, neutral, and oversold conditions.
Customizable Display:
- Option to show/hide RSI plot or RoC plot for cleaner charts.
- Candle plot overlay option to visualize current price action alongside the indicator.
Inputs:
- RSI Length: Default 28. Adjusts the lookback period for RSI calculation.
- RoC Length: Default 28. Sets the period for the Rate of Change calculation.
- Plot Settings:
- Show RSI - Toggle RSI plot visibility.
- Show RoC - Toggle RoC plot visibility.
Usage:
Long signals are indicated when the average RSI is above 50 and the RoC is positive.
Short signals are suggested when the average RSI falls below 50 with a negative RoC.
The color coding helps visually confirm trends at a glance.
Notes:
This indicator is best used in conjunction with other analysis methods to confirm signals.
Adjust the length parameters based on your trading timeframe for optimal results.
Disclaimer:
This indicator does not guarantee trading success; use it as part of a comprehensive trading strategy. Always conduct your own analysis before making trading decisions.
Phát hành các Ghi chú
.Mã nguồn mở
Theo đúng tinh thần TradingView, tác giả của tập lệnh này đã công bố nó dưới dạng mã nguồn mở, để các nhà giao dịch có thể xem xét và xác minh chức năng. Chúc mừng tác giả! Mặc dù bạn có thể sử dụng miễn phí, hãy nhớ rằng việc công bố lại mã phải tuân theo Nội quy.
🔍 Access Investing Strategies & Indicators
📊 whop.com/marktquant
🌐 marktquant.com
Nothing shared on this page constitutes financial advice. All information, tools, and analyses are provided solely for informational and educational purposes.
📊 whop.com/marktquant
🌐 marktquant.com
Nothing shared on this page constitutes financial advice. All information, tools, and analyses are provided solely for informational and educational purposes.
Thông báo miễn trừ trách nhiệm
Thông tin và các ấn phẩm này không nhằm mục đích, và không cấu thành, lời khuyên hoặc khuyến nghị về tài chính, đầu tư, giao dịch hay các loại khác do TradingView cung cấp hoặc xác nhận. Đọc thêm tại Điều khoản Sử dụng.
Mã nguồn mở
Theo đúng tinh thần TradingView, tác giả của tập lệnh này đã công bố nó dưới dạng mã nguồn mở, để các nhà giao dịch có thể xem xét và xác minh chức năng. Chúc mừng tác giả! Mặc dù bạn có thể sử dụng miễn phí, hãy nhớ rằng việc công bố lại mã phải tuân theo Nội quy.
🔍 Access Investing Strategies & Indicators
📊 whop.com/marktquant
🌐 marktquant.com
Nothing shared on this page constitutes financial advice. All information, tools, and analyses are provided solely for informational and educational purposes.
📊 whop.com/marktquant
🌐 marktquant.com
Nothing shared on this page constitutes financial advice. All information, tools, and analyses are provided solely for informational and educational purposes.
Thông báo miễn trừ trách nhiệm
Thông tin và các ấn phẩm này không nhằm mục đích, và không cấu thành, lời khuyên hoặc khuyến nghị về tài chính, đầu tư, giao dịch hay các loại khác do TradingView cung cấp hoặc xác nhận. Đọc thêm tại Điều khoản Sử dụng.