OPEN-SOURCE SCRIPT
Quarterly Performance
█ OVERVIEW
The Quarterly Performance indicator is designed to visualise and compare the performance of different Quarters of the year. This indicator explores one of the many calendar based anomalies that exist in financial markets.
In the context of financial analysis, a calendar based anomaly refers to patterns or tendencies that are linked to specific time periods, such as days of the week, weeks of the month, or months of the year. This indicator helps explore whether such a calendar based anomaly exists between quarters.
By calculating cumulative quarterly performance and counting the number of quarters with positive returns, it provides a clear snapshot of whether one set of quarters tends to outperform the others, potentially highlighting a calendar based anomaly if a significant difference is observed.
█ FEATURES
█ HOW TO USE
The Quarterly Performance indicator is designed to visualise and compare the performance of different Quarters of the year. This indicator explores one of the many calendar based anomalies that exist in financial markets.
In the context of financial analysis, a calendar based anomaly refers to patterns or tendencies that are linked to specific time periods, such as days of the week, weeks of the month, or months of the year. This indicator helps explore whether such a calendar based anomaly exists between quarters.
By calculating cumulative quarterly performance and counting the number of quarters with positive returns, it provides a clear snapshot of whether one set of quarters tends to outperform the others, potentially highlighting a calendar based anomaly if a significant difference is observed.
█ FEATURES
- Customisable time window through input settings.
- Tracks cumulative returns for each quarter separately.
- Easily adjust table settings like position and font size via input options.
- Clear visual distinction between quarterly performance using different colours.
- Built-in error checks to ensure the indicator is applied to the correct timeframe.
█ HOW TO USE
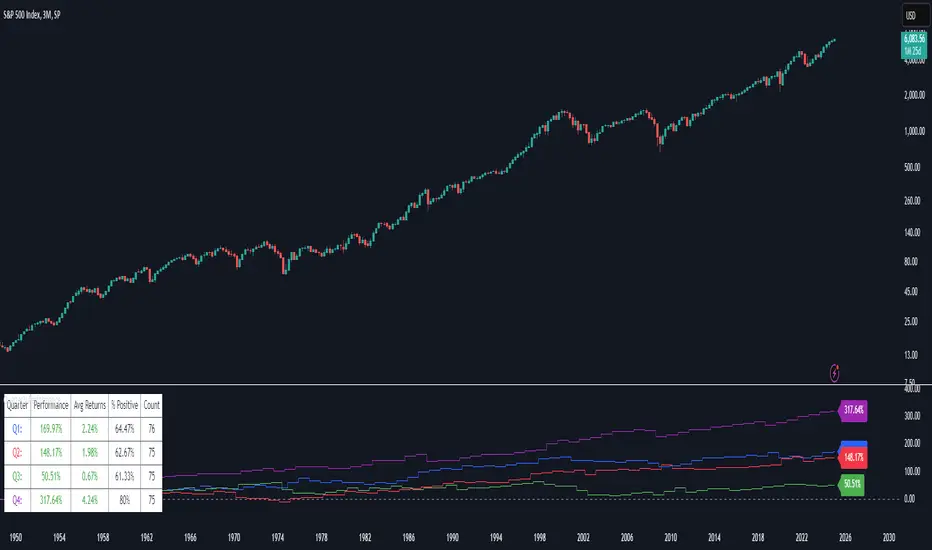
- Add the indicator to a chart with a 3 Month (Quarterly) timeframe.
- Choose your start and end dates in the Time Settings.
- Enable or disable the performance table in the Table Settings as needed.
- View the cumulative performance, with Q1 in blue, Q2 in red, Q3 in green and Q4 in purple.
Mã nguồn mở
Theo đúng tinh thần TradingView, tác giả của tập lệnh này đã công bố nó dưới dạng mã nguồn mở, để các nhà giao dịch có thể xem xét và xác minh chức năng. Chúc mừng tác giả! Mặc dù bạn có thể sử dụng miễn phí, hãy nhớ rằng việc công bố lại mã phải tuân theo Nội quy.
Thông báo miễn trừ trách nhiệm
Thông tin và các ấn phẩm này không nhằm mục đích, và không cấu thành, lời khuyên hoặc khuyến nghị về tài chính, đầu tư, giao dịch hay các loại khác do TradingView cung cấp hoặc xác nhận. Đọc thêm tại Điều khoản Sử dụng.