PINE LIBRARY
FunctionPolynomialRegression
Library "FunctionPolynomialRegression"
TODO:
polyreg(sample_x, sample_y) Method to return a polynomial regression channel using (X,Y) sample points.
Parameters:
sample_x: float array, sample data X points.
sample_y: float array, sample data Y points.
Returns: tuple with:
_predictions: Array with adjusted Y values.
_max_dev: Max deviation from the mean.
_min_dev: Min deviation from the mean.
_stdev/_sizeX: Average deviation from the mean.
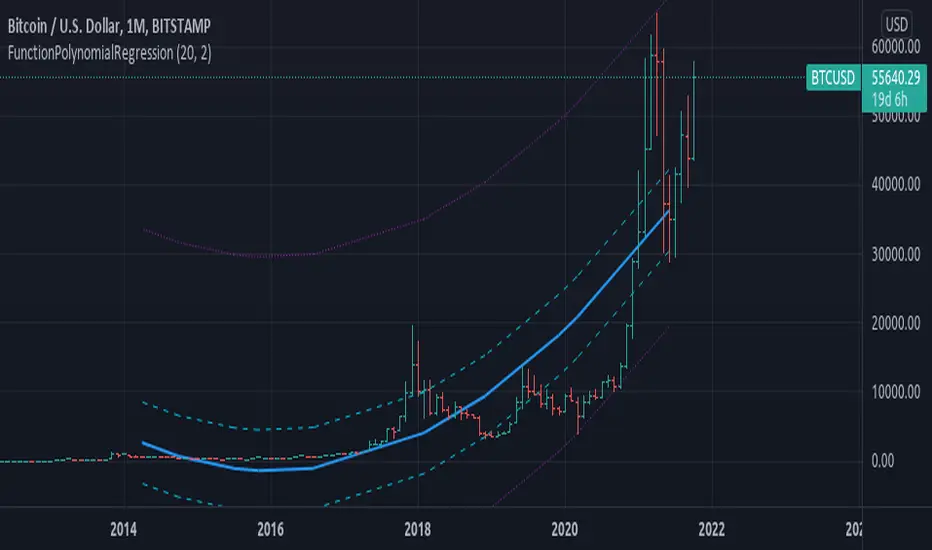
draw(sample_x, sample_y, extend, mid_color, mid_style, mid_width, std_color, std_style, std_width, max_color, max_style, max_width) Method for drawing the Polynomial Regression into chart.
Parameters:
sample_x: float array, sample point X value.
sample_y: float array, sample point Y value.
extend: string, default=extend.none, extend lines.
mid_color: color, default=color.blue, middle line color.
mid_style: string, default=line.style_solid, middle line style.
mid_width: int, default=2, middle line width.
std_color: color, default=color.aqua, standard deviation line color.
std_style: string, default=line.style_dashed, standard deviation line style.
std_width: int, default=1, standard deviation line width.
max_color: color, default=color.purple, max range line color.
max_style: string, default=line.style_dotted, max line style.
max_width: int, default=1, max line width.
Returns: line array.
TODO:
polyreg(sample_x, sample_y) Method to return a polynomial regression channel using (X,Y) sample points.
Parameters:
sample_x: float array, sample data X points.
sample_y: float array, sample data Y points.
Returns: tuple with:
_predictions: Array with adjusted Y values.
_max_dev: Max deviation from the mean.
_min_dev: Min deviation from the mean.
_stdev/_sizeX: Average deviation from the mean.
draw(sample_x, sample_y, extend, mid_color, mid_style, mid_width, std_color, std_style, std_width, max_color, max_style, max_width) Method for drawing the Polynomial Regression into chart.
Parameters:
sample_x: float array, sample point X value.
sample_y: float array, sample point Y value.
extend: string, default=extend.none, extend lines.
mid_color: color, default=color.blue, middle line color.
mid_style: string, default=line.style_solid, middle line style.
mid_width: int, default=2, middle line width.
std_color: color, default=color.aqua, standard deviation line color.
std_style: string, default=line.style_dashed, standard deviation line style.
std_width: int, default=1, standard deviation line width.
max_color: color, default=color.purple, max range line color.
max_style: string, default=line.style_dotted, max line style.
max_width: int, default=1, max line width.
Returns: line array.
Thư viện Pine
Theo đúng tinh thần TradingView, tác giả đã công bố mã Pine này như một thư viện mã nguồn mở để các lập trình viên Pine khác trong cộng đồng có thể tái sử dụng. Chúc mừng tác giả! Bạn có thể sử dụng thư viện này cho mục đích cá nhân hoặc trong các ấn phẩm mã nguồn mở khác, nhưng việc tái sử dụng mã này trong các ấn phẩm phải tuân theo Nội Quy.
Thông báo miễn trừ trách nhiệm
Thông tin và các ấn phẩm này không nhằm mục đích, và không cấu thành, lời khuyên hoặc khuyến nghị về tài chính, đầu tư, giao dịch hay các loại khác do TradingView cung cấp hoặc xác nhận. Đọc thêm tại Điều khoản Sử dụng.