OPEN-SOURCE SCRIPT
Trend Catcher SwiftEdge
Trend Catcher SwiftEdge
Overview
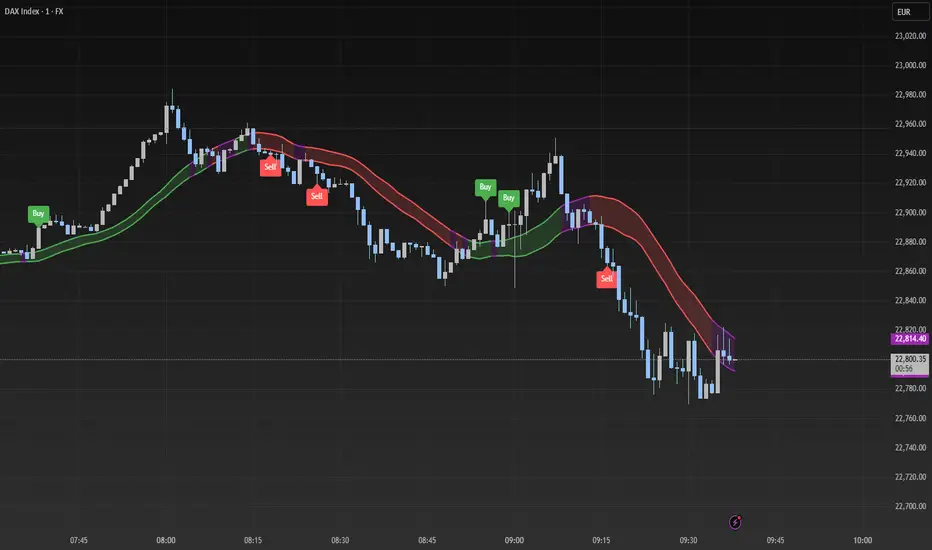
The Trend Catcher SwiftEdge is a simple yet effective tool designed to help traders identify potential trend directions using two Simple Moving Averages (SMAs). It plots two SMAs based on the high and low prices of the chart, visually highlights trend conditions, and provides buy/sell labels to assist with trade entries. This indicator is best used as part of a broader trading strategy and should not be relied upon as a standalone signal generator.
How It Works
Two SMAs: The indicator calculates two SMAs: one based on the lowest price (Low) and one based on the highest price (High) over a user-defined period (default: 20).
Dynamic Colors:
Green: When the price is above both SMAs (indicating a potential uptrend).
Red: When the price is below both SMAs (indicating a potential downtrend).
Purple: When the price is between the SMAs (indicating consolidation).
The SMAs and the background between them change color dynamically to reflect the current trend condition.
Buy/Sell Labels:
A "Buy" label appears when an entire candlestick (including its low) crosses above both SMAs, marking the start of a potential uptrend.
A "Sell" label appears when an entire candlestick (including its high) crosses below both SMAs, marking the start of a potential downtrend.
To reduce noise, only one label is shown per trend direction. The indicator resets when the price enters the consolidation zone (purple), allowing for a new signal when the next trend begins.
Settings
SMA Length: Adjust the period of the SMAs (default: 20). A longer period smooths the SMAs and focuses on larger trends, while a shorter period makes the indicator more sensitive to price changes.
How to Use
Add the indicator to your chart.
Look for "Buy" labels to consider potential long entries during uptrends (green zone).
Look for "Sell" labels to consider potential short entries during downtrends (red zone).
Use the purple consolidation zone to prepare for potential breakouts.
Always combine this indicator with other forms of analysis (e.g., support/resistance, volume, or other indicators) to confirm signals.
Important Notes
This indicator is a tool to assist with identifying trend directions and potential entry points. It does not guarantee profits and should be used as part of a comprehensive trading strategy.
False signals can occur, especially in choppy or ranging markets. Consider using additional filters or confirmations to improve reliability.
Backtest the indicator on your chosen market and timeframe to understand its behavior before using it in live trading.
Feedback
If you have suggestions or feedback, feel free to leave a comment. Happy trading!
Overview
The Trend Catcher SwiftEdge is a simple yet effective tool designed to help traders identify potential trend directions using two Simple Moving Averages (SMAs). It plots two SMAs based on the high and low prices of the chart, visually highlights trend conditions, and provides buy/sell labels to assist with trade entries. This indicator is best used as part of a broader trading strategy and should not be relied upon as a standalone signal generator.
How It Works
Two SMAs: The indicator calculates two SMAs: one based on the lowest price (Low) and one based on the highest price (High) over a user-defined period (default: 20).
Dynamic Colors:
Green: When the price is above both SMAs (indicating a potential uptrend).
Red: When the price is below both SMAs (indicating a potential downtrend).
Purple: When the price is between the SMAs (indicating consolidation).
The SMAs and the background between them change color dynamically to reflect the current trend condition.
Buy/Sell Labels:
A "Buy" label appears when an entire candlestick (including its low) crosses above both SMAs, marking the start of a potential uptrend.
A "Sell" label appears when an entire candlestick (including its high) crosses below both SMAs, marking the start of a potential downtrend.
To reduce noise, only one label is shown per trend direction. The indicator resets when the price enters the consolidation zone (purple), allowing for a new signal when the next trend begins.
Settings
SMA Length: Adjust the period of the SMAs (default: 20). A longer period smooths the SMAs and focuses on larger trends, while a shorter period makes the indicator more sensitive to price changes.
How to Use
Add the indicator to your chart.
Look for "Buy" labels to consider potential long entries during uptrends (green zone).
Look for "Sell" labels to consider potential short entries during downtrends (red zone).
Use the purple consolidation zone to prepare for potential breakouts.
Always combine this indicator with other forms of analysis (e.g., support/resistance, volume, or other indicators) to confirm signals.
Important Notes
This indicator is a tool to assist with identifying trend directions and potential entry points. It does not guarantee profits and should be used as part of a comprehensive trading strategy.
False signals can occur, especially in choppy or ranging markets. Consider using additional filters or confirmations to improve reliability.
Backtest the indicator on your chosen market and timeframe to understand its behavior before using it in live trading.
Feedback
If you have suggestions or feedback, feel free to leave a comment. Happy trading!
Mã nguồn mở
Theo đúng tinh thần TradingView, tác giả của tập lệnh này đã công bố nó dưới dạng mã nguồn mở, để các nhà giao dịch có thể xem xét và xác minh chức năng. Chúc mừng tác giả! Mặc dù bạn có thể sử dụng miễn phí, hãy nhớ rằng việc công bố lại mã phải tuân theo Nội quy.
Thông báo miễn trừ trách nhiệm
Thông tin và các ấn phẩm này không nhằm mục đích, và không cấu thành, lời khuyên hoặc khuyến nghị về tài chính, đầu tư, giao dịch hay các loại khác do TradingView cung cấp hoặc xác nhận. Đọc thêm tại Điều khoản Sử dụng.