OPEN-SOURCE SCRIPT
sadosi trends and barrier
This indicator should be used for give ideas.
what they can do?
how can?
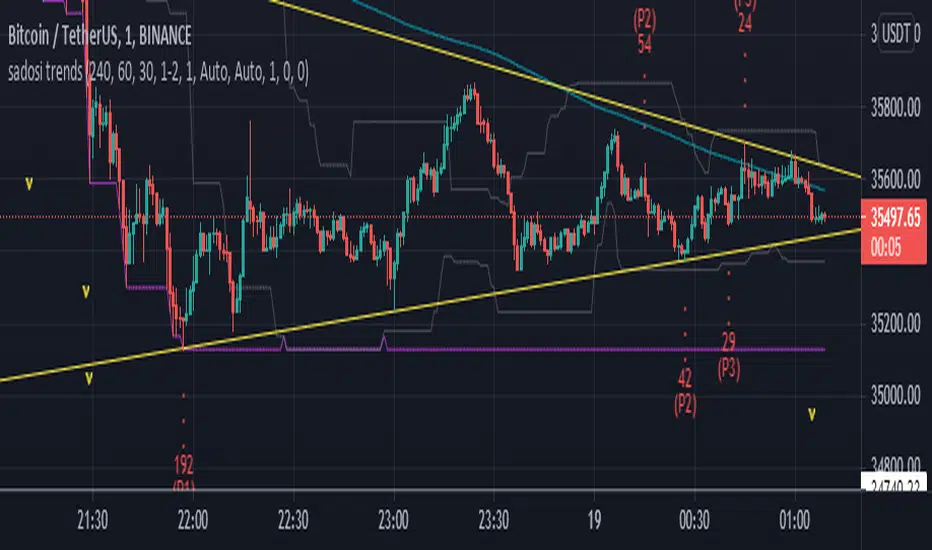
By analyzing the prices in the 3 selected periods, 3 highs and 3 lows prices are marked. With the marked points, trend and resistance lines are drawn. The current price is analyzed and useful calculations displayed in the info box. Finaly adding moving averages. After all these transactions, the trend and resistances become easily visible on the chart.
You can fine-tune the angle of the trend using high and low extensions
you can catch different trend lines by changing the high and low trend points
By changing the periods, you can set position the trend lines more accurately.
When the price is too low or too high, the information box will warn you by change color.
The trend lines to be created are for the purpose of giving an idea and convenience. It can be used on all timeframes, including horizontal trends.
what they can do?
- draw up and down trend lines
- draw support and resistance lines
- to inform about the current price
- signal for high and low prices
how can?
By analyzing the prices in the 3 selected periods, 3 highs and 3 lows prices are marked. With the marked points, trend and resistance lines are drawn. The current price is analyzed and useful calculations displayed in the info box. Finaly adding moving averages. After all these transactions, the trend and resistances become easily visible on the chart.
You can fine-tune the angle of the trend using high and low extensions
you can catch different trend lines by changing the high and low trend points
By changing the periods, you can set position the trend lines more accurately.
When the price is too low or too high, the information box will warn you by change color.
The trend lines to be created are for the purpose of giving an idea and convenience. It can be used on all timeframes, including horizontal trends.
Mã nguồn mở
Theo đúng tinh thần TradingView, tác giả của tập lệnh này đã công bố nó dưới dạng mã nguồn mở, để các nhà giao dịch có thể xem xét và xác minh chức năng. Chúc mừng tác giả! Mặc dù bạn có thể sử dụng miễn phí, hãy nhớ rằng việc công bố lại mã phải tuân theo Nội Quy.
Thông báo miễn trừ trách nhiệm
Thông tin và các ấn phẩm này không nhằm mục đích, và không cấu thành, lời khuyên hoặc khuyến nghị về tài chính, đầu tư, giao dịch hay các loại khác do TradingView cung cấp hoặc xác nhận. Đọc thêm tại Điều khoản Sử dụng.