OPEN-SOURCE SCRIPT
Cập nhật Expected Z-Scored Price
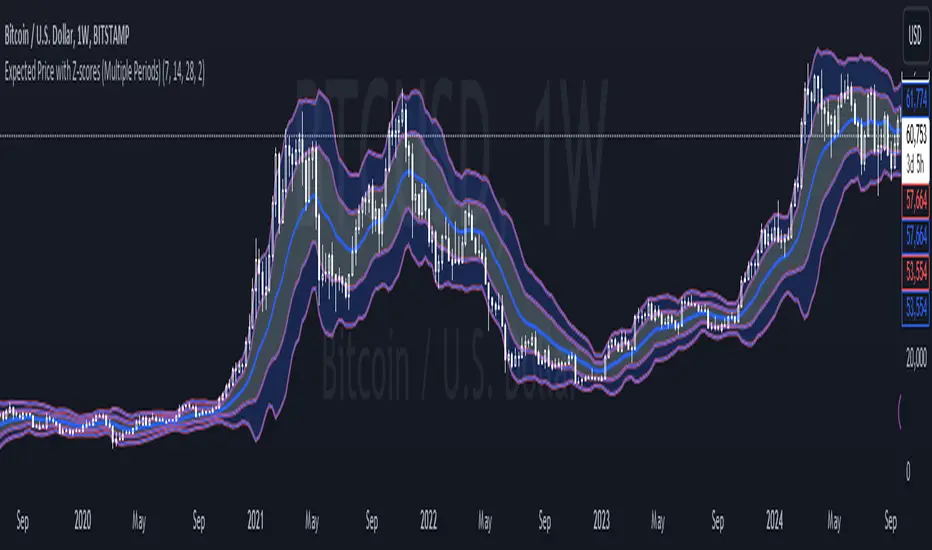
Expected Z-Scored Price is a Mean Reversion based indicator, it shows you where the price should be based on its average price and its average increase over the set previous period, indicating whether the price is under/overvalued giving a unique insight into the current value of an asset, for example  BTCUSD , however is designed for all assets that move in price.
How to read the Expected Z-scored price?
1. Zoom closer, you will see a line in the middle, this is where the price should be based on its average price and its movement
2. The lines above/below are the Standard Deviations (SD) of this expected price, if the price is in the lower price bands or even below them, it is undervalued and it is time to buy/accumulate it, if the price is above the mean (average) price, it is undervalued and should be sold.
It is that easy!
!WATCH OUT!
- This is not a Trend Following indicator, it does not indicate the prices direction, therefore if the asset is undervalued it can still go down, the bands indicate the significancy of the under/overvalueness
- It is not 100% accurate
- Watch out for the significancy of the undervalue or overvalue
Bit more info
- Each line is one SD away from the mean
- Adjusting the timeframe will help you keep the mean and its SDs on the signal period you want them to
- You can adjust the color, thickness of the lines and bands in settings
Phát hành các Ghi chú
NEW MINI UPDATE!Now one of components of Expected price Z-score is an average of 3 periods, that will be adjustable
Mã nguồn mở
Theo đúng tinh thần TradingView, người tạo ra tập lệnh này đã biến tập lệnh thành mã nguồn mở để các nhà giao dịch có thể xem xét và xác minh công năng. Xin dành lời khen tặng cho tác giả! Mặc dù bạn có thể sử dụng miễn phí, nhưng lưu ý nếu đăng lại mã, bạn phải tuân theo Quy tắc nội bộ của chúng tôi.
Thông báo miễn trừ trách nhiệm
Thông tin và ấn phẩm không có nghĩa là và không cấu thành, tài chính, đầu tư, kinh doanh, hoặc các loại lời khuyên hoặc khuyến nghị khác được cung cấp hoặc xác nhận bởi TradingView. Đọc thêm trong Điều khoản sử dụng.