OPEN-SOURCE SCRIPT
[PX] Pivot Zones
Hello everyone,
I was having some fun with the new gradient function, arrays and pivots. Decided that i would publish my little playground :)
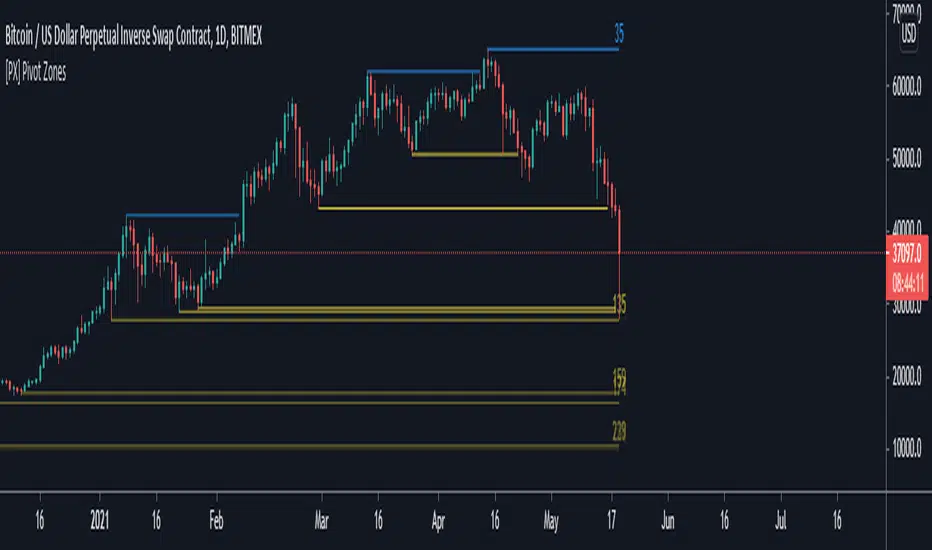
This script basically draws lines or zones for detected pivot high and lows and counts the number of candles those levels have been untested.
Tested levels will stop at the candle, which breaks them.
How does it work?
- Define the number of candles that make up the pivot point with the "Pivot Left" and "Pivot Right" parameter (I took more extreme values to showcase the indicator).
- Select your "Layout Type": This can be either a line at the pivot point, a zone between the pivot point and its body or the average of the two.
- You can in-/decrease the number of lines with the "Number of Lines/Zones" parameter.
The older a line becomes the more it will lose of its original transparency.
Hope that might be useful to some of you :)
Please click the "Like"-button and follow me for future open-source script publications.
If you are looking for help with your custom PineScript development, don't hesitate to contact me directly here on Tradingview or through the link in my signature :)
I was having some fun with the new gradient function, arrays and pivots. Decided that i would publish my little playground :)
This script basically draws lines or zones for detected pivot high and lows and counts the number of candles those levels have been untested.
Tested levels will stop at the candle, which breaks them.
How does it work?
- Define the number of candles that make up the pivot point with the "Pivot Left" and "Pivot Right" parameter (I took more extreme values to showcase the indicator).
- Select your "Layout Type": This can be either a line at the pivot point, a zone between the pivot point and its body or the average of the two.
- You can in-/decrease the number of lines with the "Number of Lines/Zones" parameter.
The older a line becomes the more it will lose of its original transparency.
Hope that might be useful to some of you :)
Please click the "Like"-button and follow me for future open-source script publications.
If you are looking for help with your custom PineScript development, don't hesitate to contact me directly here on Tradingview or through the link in my signature :)
Mã nguồn mở
Theo đúng tinh thần TradingView, tác giả của tập lệnh này đã công bố nó dưới dạng mã nguồn mở, để các nhà giao dịch có thể xem xét và xác minh chức năng. Chúc mừng tác giả! Mặc dù bạn có thể sử dụng miễn phí, hãy nhớ rằng việc công bố lại mã phải tuân theo Nội quy.
🙋♂️Listed as "Trusted Pine Programmer for Hire"
💰Save $30 on your Tradingview subscription: bit.ly/3OtLyNz
🔓Indicator access: dize-trading.de/
🔒Trial access: discord.gg/DqwKjBZ8Qe
💰Save $30 on your Tradingview subscription: bit.ly/3OtLyNz
🔓Indicator access: dize-trading.de/
🔒Trial access: discord.gg/DqwKjBZ8Qe
Thông báo miễn trừ trách nhiệm
Thông tin và các ấn phẩm này không nhằm mục đích, và không cấu thành, lời khuyên hoặc khuyến nghị về tài chính, đầu tư, giao dịch hay các loại khác do TradingView cung cấp hoặc xác nhận. Đọc thêm tại Điều khoản Sử dụng.