OPEN-SOURCE SCRIPT
Pivot Web
The Pivot Web is a prototype with its base derived from TradingView's standard pivot point indicator plus inspiration from LuxAlgo's trendline work alongside my own observations/experiences.
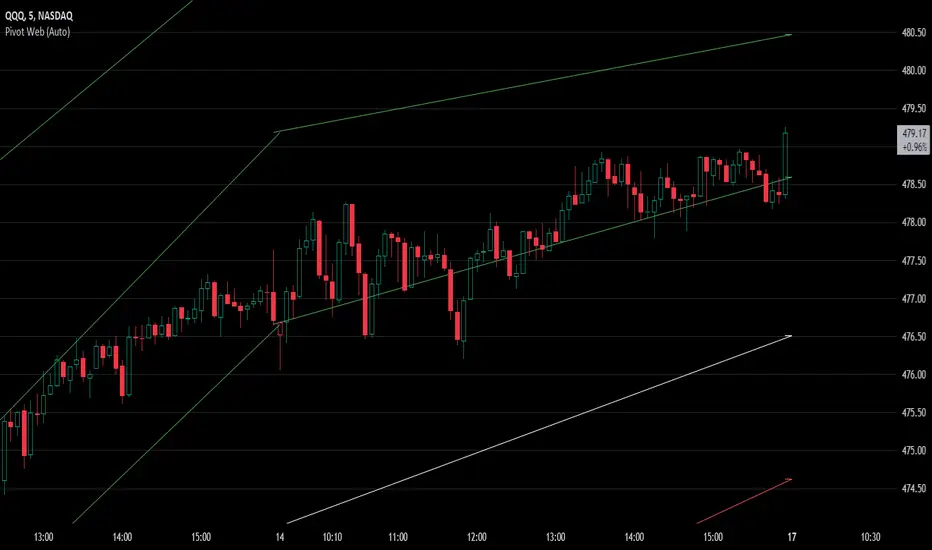
The theory is that there's legitimacy, from a technical standpoint, pivot point calculations are an adequate gauge of momentum and sentiment because the same math was used under pressure by floor traders themselves. That calculation is centered on the average of high, low, and closing prices. This indicator creates trendlines connecting the last pivot, support, and resistance levels to the current ones. A dynamic visual cue could make it easier to assess if the price will continue or reverse the current trajectory. This method also shows us an excellent visual for volatility.
Key Takeaways:
Lastly, note the first set of data in each new timeframe displays the current original pivot point levels along with the trendlines attached to their ending point. Most of the time this indicator leaves room by briefly highlighting the original static levels with all levels also being optional displays. Also note that a more stable asset may not require the outermost support and resistance levels. Like most time series analysis tools, the Pivot Web requires current data to function properly.
"Nature is pleased with simplicity, and nature is no dummy."
The theory is that there's legitimacy, from a technical standpoint, pivot point calculations are an adequate gauge of momentum and sentiment because the same math was used under pressure by floor traders themselves. That calculation is centered on the average of high, low, and closing prices. This indicator creates trendlines connecting the last pivot, support, and resistance levels to the current ones. A dynamic visual cue could make it easier to assess if the price will continue or reverse the current trajectory. This method also shows us an excellent visual for volatility.
Key Takeaways:
- This indicator draws new dynamic trendlines.
- These new trendlines connect the past and present pivot point levels based on the timeframe you select.
Shorter timeframes = More trendlines
- Price adherence to the path of these lines may offer insight for trading.
Lastly, note the first set of data in each new timeframe displays the current original pivot point levels along with the trendlines attached to their ending point. Most of the time this indicator leaves room by briefly highlighting the original static levels with all levels also being optional displays. Also note that a more stable asset may not require the outermost support and resistance levels. Like most time series analysis tools, the Pivot Web requires current data to function properly.
"Nature is pleased with simplicity, and nature is no dummy."
Mã nguồn mở
Theo đúng tinh thần TradingView, tác giả của tập lệnh này đã công bố nó dưới dạng mã nguồn mở, để các nhà giao dịch có thể xem xét và xác minh chức năng. Chúc mừng tác giả! Mặc dù bạn có thể sử dụng miễn phí, hãy nhớ rằng việc công bố lại mã phải tuân theo Nội quy.
KP
Thông báo miễn trừ trách nhiệm
Thông tin và các ấn phẩm này không nhằm mục đích, và không cấu thành, lời khuyên hoặc khuyến nghị về tài chính, đầu tư, giao dịch hay các loại khác do TradingView cung cấp hoặc xác nhận. Đọc thêm tại Điều khoản Sử dụng.