OPEN-SOURCE SCRIPT
Cập nhật RSI Trendspotter
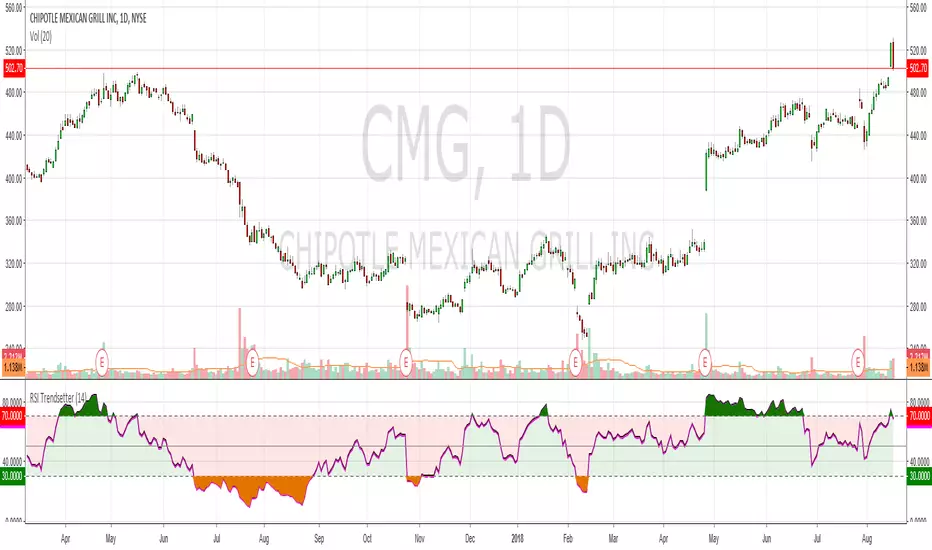
Had a bit of a TA epiphany with RSI so bear with me. The time since RSI was last overbought/sold is a solid trend indicator. This may seem obvious but after x number of years trading it hit me like a smack in the face. I've coded this for easy visualisation. They're fairly simple changes but it's making a big difference in my trendspotting already.
In the example CMG hasn't been overbought for 183 days, so the RSI is mostly green:
Before that it hadn't been oversold for 199 days, so RSI is mostly red:
And before that it was ranging like a maf*ckin' sine wave, so the RSI shows green, red, green, red, etc.:
Finally, normal RSI for comparison. Same data, but now with pretty colours:
I've also added overbought/oversold highlights cause that just makes the whole charting thing a lot easier. Enjoy!
Phát hành các Ghi chú
Bugger, I said overbought when I mean oversold and vice-versaPhát hành các Ghi chú
Added plot descriptions so peeps and change colours easily. Thanks to FLOW for the feedbackPhát hành các Ghi chú
Fixed an issue with colour and the source. Due to Pine Script limitations it's not possible to make this look the same on a black chart, so you will need to manually adjust the colours when you add it to your chartMã nguồn mở
Theo đúng tinh thần TradingView, tác giả của tập lệnh này đã công bố nó dưới dạng mã nguồn mở, để các nhà giao dịch có thể xem xét và xác minh chức năng. Chúc mừng tác giả! Mặc dù bạn có thể sử dụng miễn phí, hãy nhớ rằng việc công bố lại mã phải tuân theo Nội quy.
Thông báo miễn trừ trách nhiệm
Thông tin và các ấn phẩm này không nhằm mục đích, và không cấu thành, lời khuyên hoặc khuyến nghị về tài chính, đầu tư, giao dịch hay các loại khác do TradingView cung cấp hoặc xác nhận. Đọc thêm tại Điều khoản Sử dụng.
Mã nguồn mở
Theo đúng tinh thần TradingView, tác giả của tập lệnh này đã công bố nó dưới dạng mã nguồn mở, để các nhà giao dịch có thể xem xét và xác minh chức năng. Chúc mừng tác giả! Mặc dù bạn có thể sử dụng miễn phí, hãy nhớ rằng việc công bố lại mã phải tuân theo Nội quy.
Thông báo miễn trừ trách nhiệm
Thông tin và các ấn phẩm này không nhằm mục đích, và không cấu thành, lời khuyên hoặc khuyến nghị về tài chính, đầu tư, giao dịch hay các loại khác do TradingView cung cấp hoặc xác nhận. Đọc thêm tại Điều khoản Sử dụng.