OPEN-SOURCE SCRIPT
Buy/Sell Volume Totals for Period

This indicator can be used to help you tell the difference between Wyckoff Accumulation and Distribution.
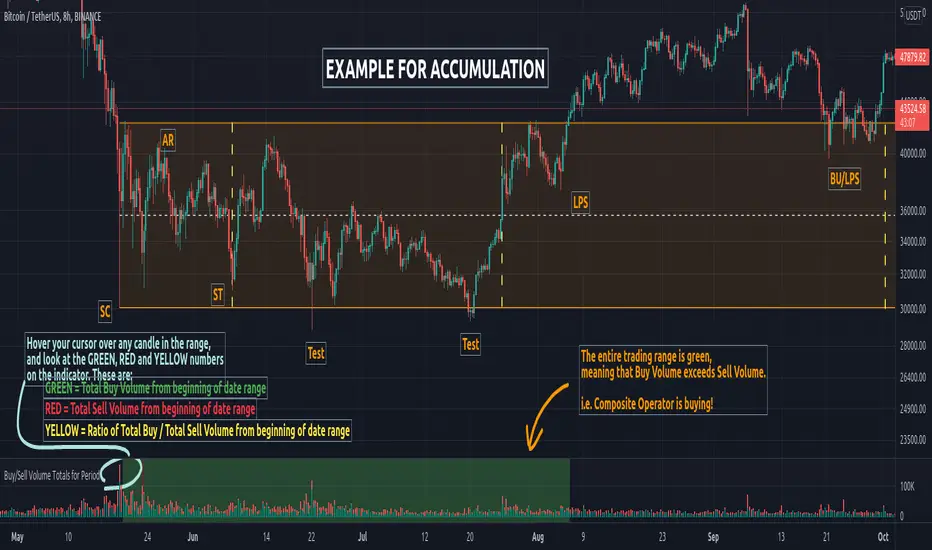
The idea is to add up all the Buy Volume and all the Sell Volume separately from the beginning of the Trading Range (TR) for each candle. You can define the Start and End dates in the settings of the indicator.
The indicator will show you 3 numbers of interest:
When the Total Buy Volume exceeds the Total Sell Volume in the TR, the indicator will color the background in GREEN color, to indicate possible accumulation. Otherwise the background will be RED, to indicate possible distribution.
You can float your cursor over any candle to see the current Volume Totals at that candle from the beginning of the TR (set by you in settings to a specific date).
Here's a few examples of the indicator in action:
1) Accumulation

2) Distribution

3) Possible Re-distribution

Please note that this indicator is meant to be used in combination with other analysis techniques from the Wyckoff Methodology!
The idea is to add up all the Buy Volume and all the Sell Volume separately from the beginning of the Trading Range (TR) for each candle. You can define the Start and End dates in the settings of the indicator.
The indicator will show you 3 numbers of interest:
- GREEN = Total Buy Volume from beginning of date range
- RED = Total Sell Volume from beginning of date range
- YELLOW = Ratio of Total Buy / Total Sell Volume from beginning of date range
When the Total Buy Volume exceeds the Total Sell Volume in the TR, the indicator will color the background in GREEN color, to indicate possible accumulation. Otherwise the background will be RED, to indicate possible distribution.
You can float your cursor over any candle to see the current Volume Totals at that candle from the beginning of the TR (set by you in settings to a specific date).
Here's a few examples of the indicator in action:
1) Accumulation
2) Distribution
3) Possible Re-distribution
Please note that this indicator is meant to be used in combination with other analysis techniques from the Wyckoff Methodology!
Mã nguồn mở
Theo đúng tinh thần TradingView, tác giả của tập lệnh này đã công bố nó dưới dạng mã nguồn mở, để các nhà giao dịch có thể xem xét và xác minh chức năng. Chúc mừng tác giả! Mặc dù bạn có thể sử dụng miễn phí, hãy nhớ rằng việc công bố lại mã phải tuân theo Nội quy.
Thông báo miễn trừ trách nhiệm
Thông tin và các ấn phẩm này không nhằm mục đích, và không cấu thành, lời khuyên hoặc khuyến nghị về tài chính, đầu tư, giao dịch hay các loại khác do TradingView cung cấp hoặc xác nhận. Đọc thêm tại Điều khoản Sử dụng.