OPEN-SOURCE SCRIPT
wEMPlot
Description:
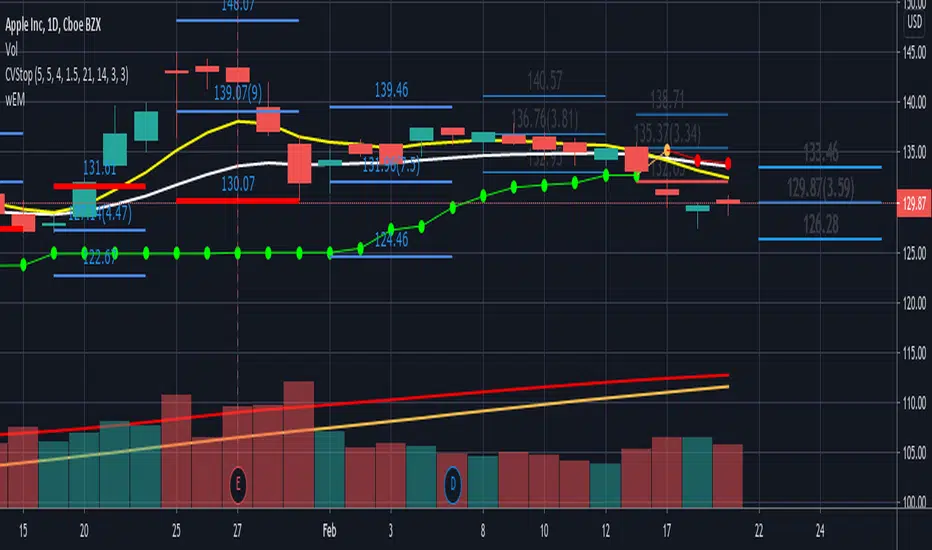
Plots the Weekly Expected Move (wEM) using the following week's Option Chain ATM Call+Put ask price to determine the EM for the following week
The wEM is the options market pricing in the expected future volatility for the following week.
The wEM is the range that the underlying price will be contained during the week 68% of the time.
These levels can be used as targets for options or equity trades for either directional or non-directional trades.
The options market in the major indices, such as SPX, can drive the overall market's order flow and so the EM can provide
useful insight into the hedging levels being used by professionals and market markers.
As Trading View does not currently provide access to option chain data, the option chain expected move for an underlying has to be manually
entered each week, but the script provides an easy to use framework to enter the parameters for the next week.
These parameters are as follows:
eg.
t1_1 = timestamp(2021, 02, 08) <==== timestamp for the start of next week (yyyy,mm,dd)
t1_2 = timestamp(2021, 02, 12) <==== timestamp for the end of next week (yyyy,mm,dd)
plotwem("QQQ", 331.36, 5.86, t1_1, t1_2, 0, 0)
^^^^
plotwem(Symbol, Close-last-week, Expected Move next week, Next week start timestamp, Next week end timestamp, Highlight-Upper-EM, Highlight-Lower-EM)
Parameters are:
Symbol : Underlying chart symbol (aka ticker). Can be a symbol for equity, future or index.
Close-last-week: Closing price at the end of last week.
Expected Move next week: The Expected Move for next week: Calculated from next week's Option Chain ATM Call+Put ask price
Next week start timestamp : Timestamp for the start of next week
Next week end timestamp : Timestamp for the end of next week
Highlight-Upper-EM : highlight upper expected move level. Set to 1 to highlight with red color. Set to 0 is no highlight.
Highlight-Lower-EM : highlight lower expected move level. Set to 1 to highlight with red color. Set to 0 is no highlight.
The highlight parameters can be updated at any point to indicate that the underlying has either touched the EM level or breached the level.
The highlights can be used to visually determine periods of market instability which can provide insight into applicable strategies for the market conditions.
Mã nguồn mở
Theo đúng tinh thần TradingView, tác giả của tập lệnh này đã công bố nó dưới dạng mã nguồn mở, để các nhà giao dịch có thể xem xét và xác minh chức năng. Chúc mừng tác giả! Mặc dù bạn có thể sử dụng miễn phí, hãy nhớ rằng việc công bố lại mã phải tuân theo Nội quy.
Thông báo miễn trừ trách nhiệm
Thông tin và các ấn phẩm này không nhằm mục đích, và không cấu thành, lời khuyên hoặc khuyến nghị về tài chính, đầu tư, giao dịch hay các loại khác do TradingView cung cấp hoặc xác nhận. Đọc thêm tại Điều khoản Sử dụng.